How to Use Healthcare Analytics to Improve Care Access
By Ivy Deng and Polly Shih
May 4, 2022
In recent years, momentum among Accountable Care Organizations (ACOs) to improve health equity has increased. The Centers for Medicare & Medicaid Services’ announcement of the redesigned ACO REACH contracting model to improve health equity will only accelerate this momentum.
In this blog, we will help ACOs and healthcare payers understand how healthcare analytics can be used to identify health equity challenges and track improvement initiatives’ progress.
What is Health Equity?
The White House and CMMI define the term “equity” as the consistent and systematic fair, just, and impartial treatment of all individuals, including individuals who belong to underserved communities that have been denied such treatment, such as Black, Latino, and Indigenous and Native American persons, Asian Americans and Pacific Islanders and other persons of color; members of religious minorities; LGBTQ+ persons; persons with disabilities; persons who live in rural areas; and persons otherwise adversely affected by persistent poverty or inequality.
Given this definition, health equity refers to the ability to provide the same level of care and treatment outcomes regardless of demographic factors such as a patient’s income, location, gender, or race. These factors, known as Social Determinants of Health, have been shown to lead to unequal health costs and outcomes among specific population segments. Examples include:
- Geography: rural communities may struggle with care access due to a lack of facilities in their area, the majority of which might require longer travel times.
- Language: non-native-English speakers may struggle to understand provider conversations or medication instructions, leading to treatment difficulties.
- Adverse Childhood Events (ACE) Score: a higher frequency of negative experiences in childhood and teenage years may put children at risk for chronic health problems, mental illness, and substance use in adulthood.
- Income Level: lower-income individuals often lack insurance coverage and, as a result, tend to put off care until an emergency arises. Even for lower-income individuals with insurance, copays and deductibles can cause barriers to receiving care. These individuals often rely on emergency care for chronic conditions that could have been treated much earlier, which drives up care costs.
How Do Health Equity Issues Affect the Healthcare Industry?
The impact of health equity challenges on the industry cannot be overstated. These issues are one of the primary drivers of increased costs among providers, and the continuing federal incentives to resolve them represent significant opportunities to improve treatment business models.
Increased Costs
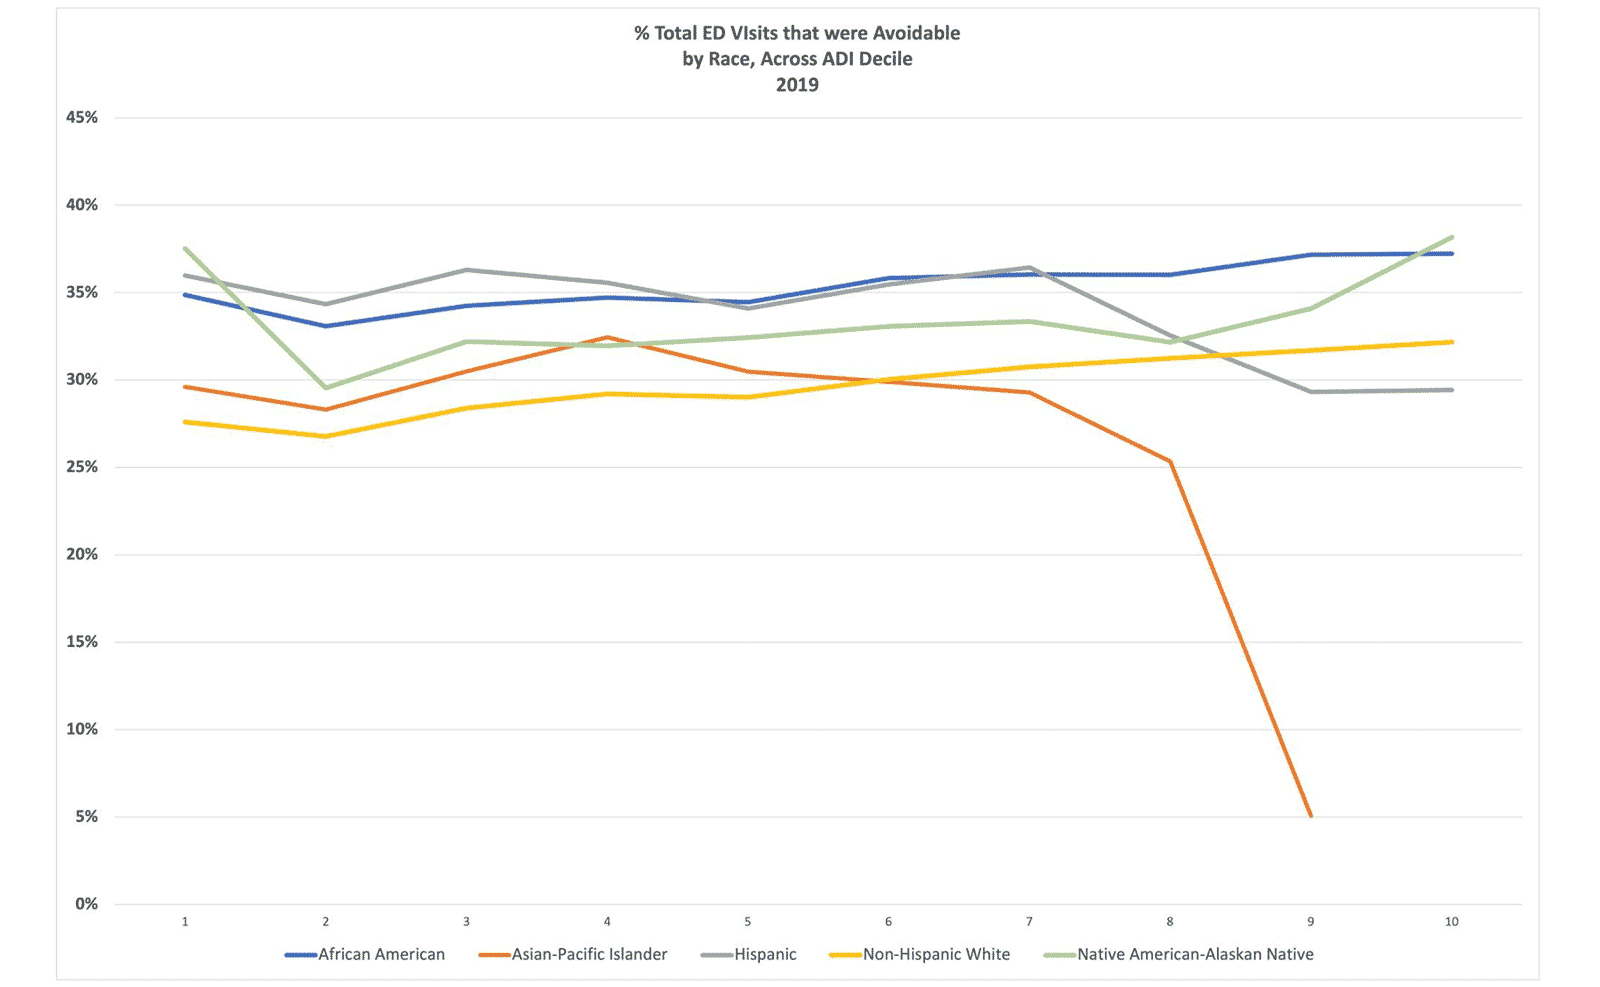
As discussed above, avoidable emergency visits are one of the largest costs related to health equity issues. On average, the cost of care provided in a hospital emergency department (ED) is 12 times higher than in a physician’s office, and 10 times higher than in an urgent care center. Estimates on how many hospital ED visits are avoidable range widely, but their occurrence indicates health inequity in a health system. Those beneficiaries are likely not receiving necessary primary and preventive care and could’ve been treated in high-quality, low-cost primary care settings.

Data Source: CareJourney
Pharmaceutical manufacturers also face cost challenges related to health equity. These companies spend billions on drug research and manufacturing, only to have patients not fulfill or follow prescriptions due to issues like medication cost or the distance to the nearest pharmacy. The NIH estimates that medication adherence issues cost the industry $100 billion each year, and results in greater than 100,000 preventable deaths.
Opportunities to Improve Business Models
Medicare Alternative Payment Models incent providers to lower the total cost of care for a population, as opposed to driving revenue through increased volume of services. As such, improving care among riskier populations presents a significant business opportunity.
Doing so, however, requires an aggressive approach to delivering preventative care among these populations. Many payers seek to do so through Medicare Advantage supplemental benefits, which can provide resources like air purifiers to help patients with asthma improve their breathing before an issue requires an emergency visit.
How is Health Equity Measured?
The ACO REACH model and the CDC use the same definition of “health disparities” when referring to health equity: preventable differences in the burden of disease, injury, violence, or in opportunities to achieve optimal health experienced by socially disadvantaged racial, ethnic, and other population groups, and communities.
Health equity challenges resulting from these health disparities can be measured in a number of ways, all of which are included within the CareJourney dataset:
- Social Vulnerability Index (SVI): this CDC-maintained database quantifies the potential negative effects on communities caused by external stresses on human health in a county-level index. This index is compiled from a number of U.S. Census-gathered data points, with zip code being the most significant.
- Area Deprivation Index (ADI): maintained by the University of Wisconsin, ADI ranks census block groups by socioeconomic disadvantage, using data including income, education, employment, and housing quality. CMS’s REACH model incorporates ADI data along with other factors such as dual Medicare/Medicaid enrollment.
- Distressed Community Index (DCI): the Economic Innovation Group’s Distressed Community Index reviews metrics including employment, education and income by several different geographic regions. Read how we used DCI to analyze how social determinants corresponded to uptake of COVID-19 vaccinations.
While the above indices are macro-level measurements, they include many factors outside a value-based care provider’s area of influence. As a result, CareJourney often focuses on Avoidable ER Visits as one of its “real-world” proxies for health equity performance.
Our research on social determinants of health has shown that the higher number of avoidable visits an emergency provider records, the more likely that health equity in the provider’s service area is sub-optimal. Specifically, we found that avoidable ED rate is positively correlated with household crowding (measured using percent of occupied households with more than one person per room) and with percent of households receiving food stamps.
Improving Health Equity Delivery with Healthcare Analytics
As payers begin care outreach and improvement programs, they can use the metrics below to help document these efforts’ improvements in measures of health equity:
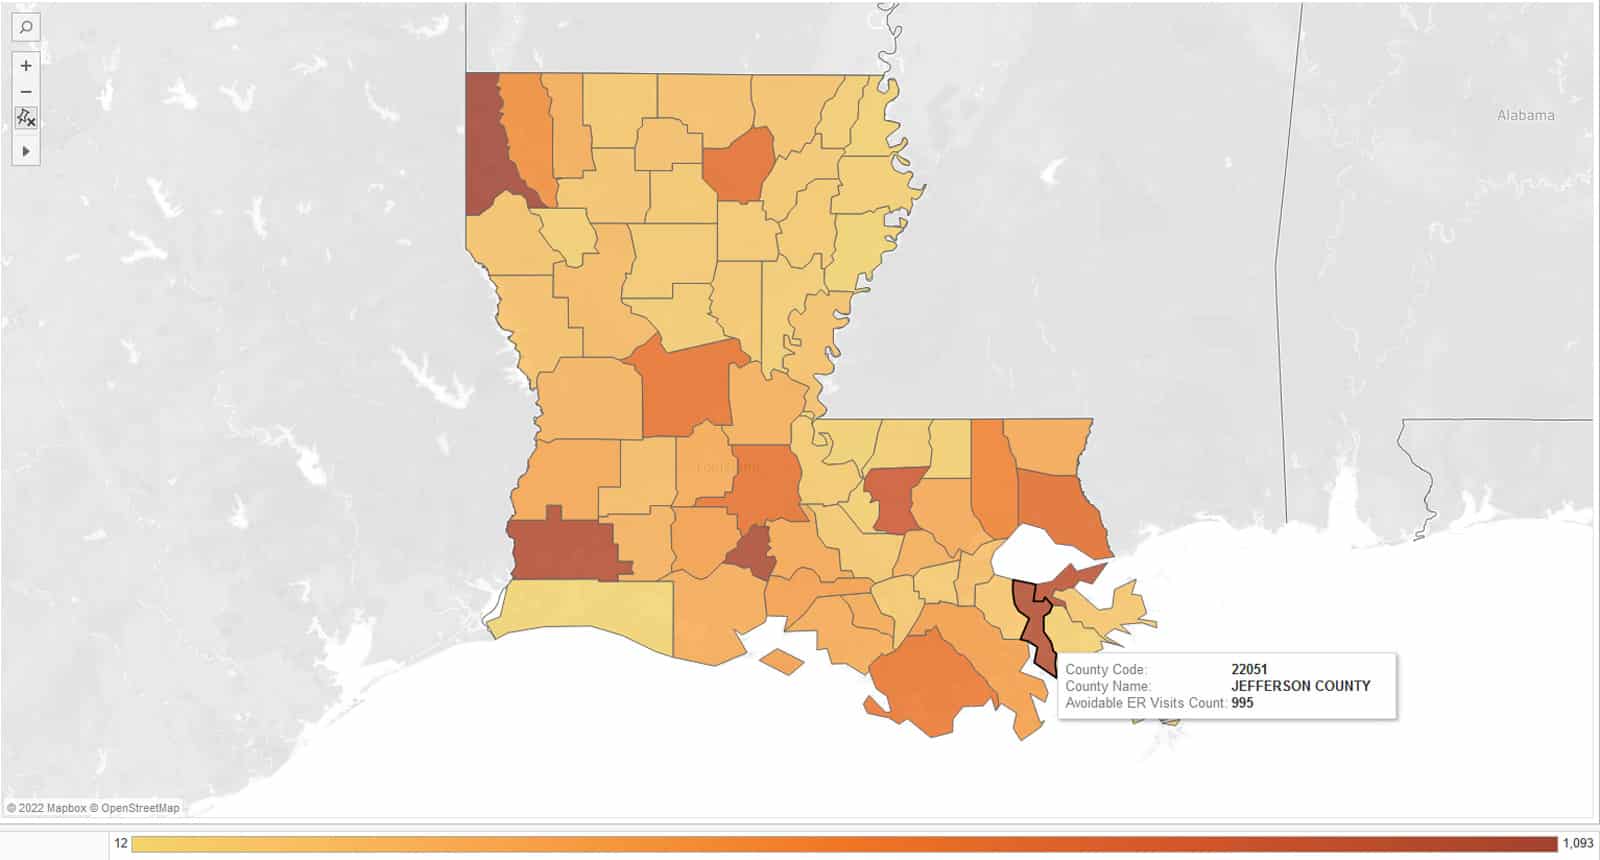
Avoidable ER Visits: Reviewing avoidable ER visit data (using the NYU methodology) by a geographic or distressed population filter can help track the effectiveness of preventative care intervention programs over time. As these programs are not overnight fixes, longitudinal healthcare data is ideal in this tracking. CareJourney typically maintains a five-year minimum data timespan to help track improvement.
As an example, a payer in Louisiana might seek to identify the counties where it sees the most avoidable visits and target its Medicare Advantage supplemental benefits programs to these locations first. Evaluating data for the next 2-3 years will show if the program has been effective.
To learn more about how the Louisiana Physicians ACO was able to accomplish a 16% reduction in avoidable hospital visits using healthcare analytics, you can read CareJourney’s related case study.
Avoidable ER Visits Count by Louisiana County

Data Source: CareJourney
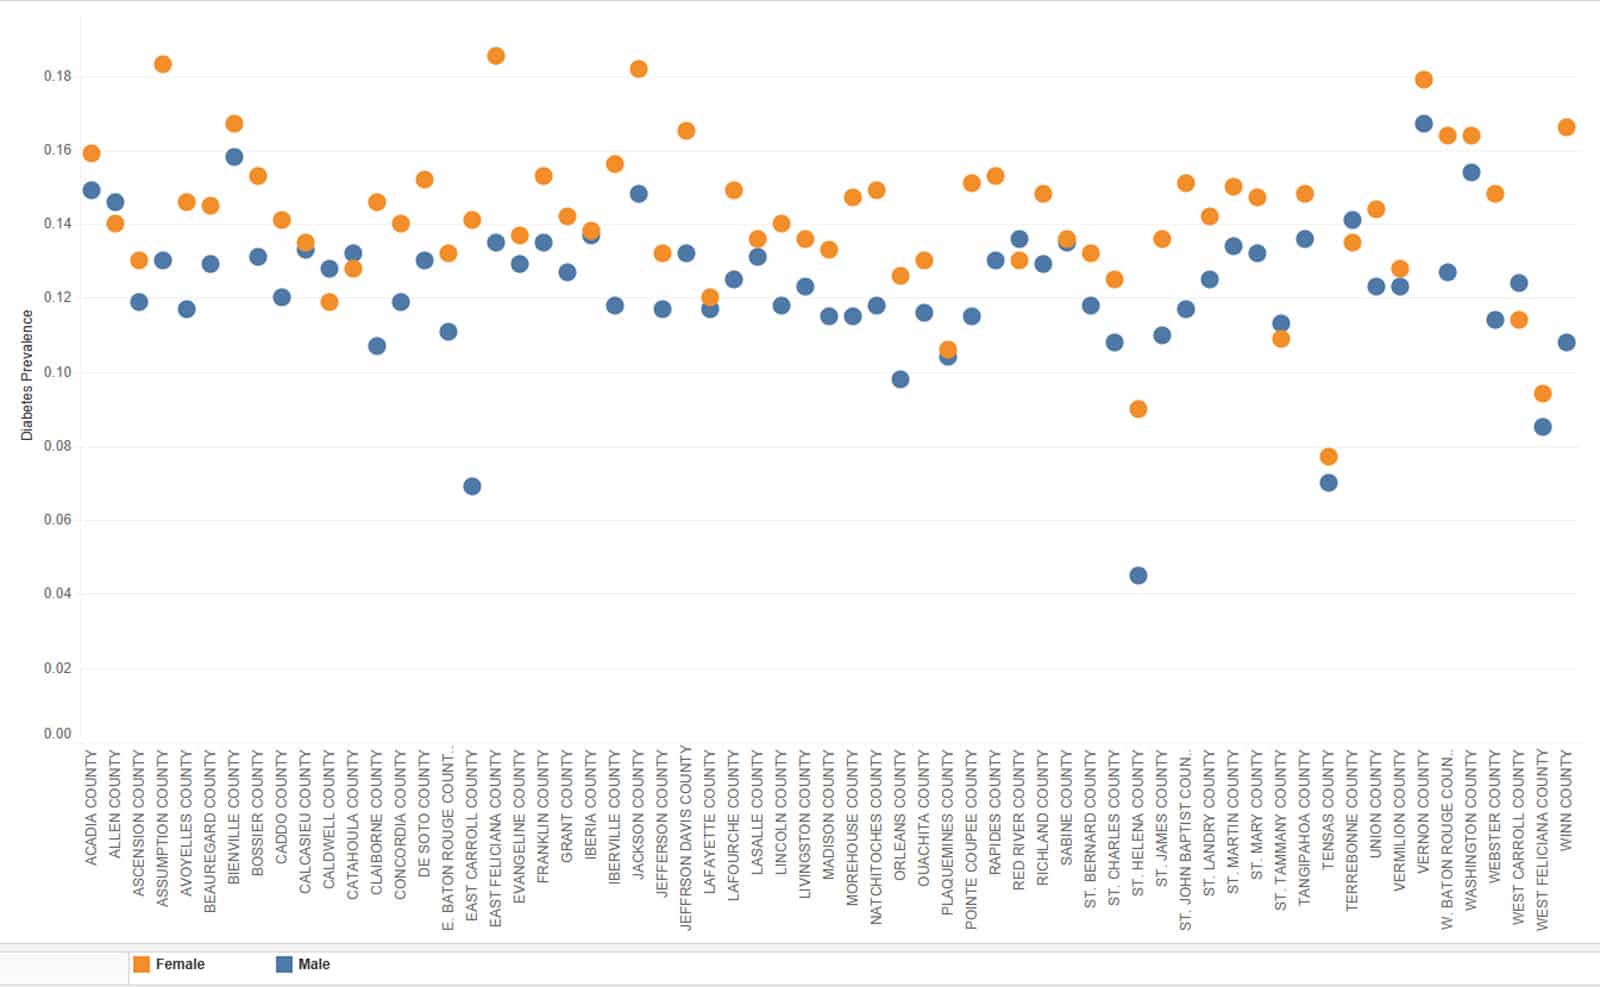
Incident rates by patient cohort: Patient cohort data can be sliced into very granular segments tied to a number of health equity risk factors (age, race, gender, zip code, etc.). Care providers can then review the prevalence of health issues among these cohorts, and compare each cohort’s incident rate to look for any discrepancies.
Continuing our Louisiana example, a payer may look for the prevalence of diabetes between men and women in its target geographies, and work with providers to increase early diabetes screenings among the gender with higher rates in order to reduce the disease’s severity in the future.
Diabetes Prevalence in Louisiana by County

Data Source: CareJourney
Provider care cost and outcome rankings: ACOs can look to identify providers operating in counties or zip codes that have high CDC social vulnerability ratings to identify those providers who are achieving the best outcomes at the lowest costs (CareJourney aggregates these measurements into a Provider Performance Index). They can then work with these providers to scale operations or replicate procedures across their network.

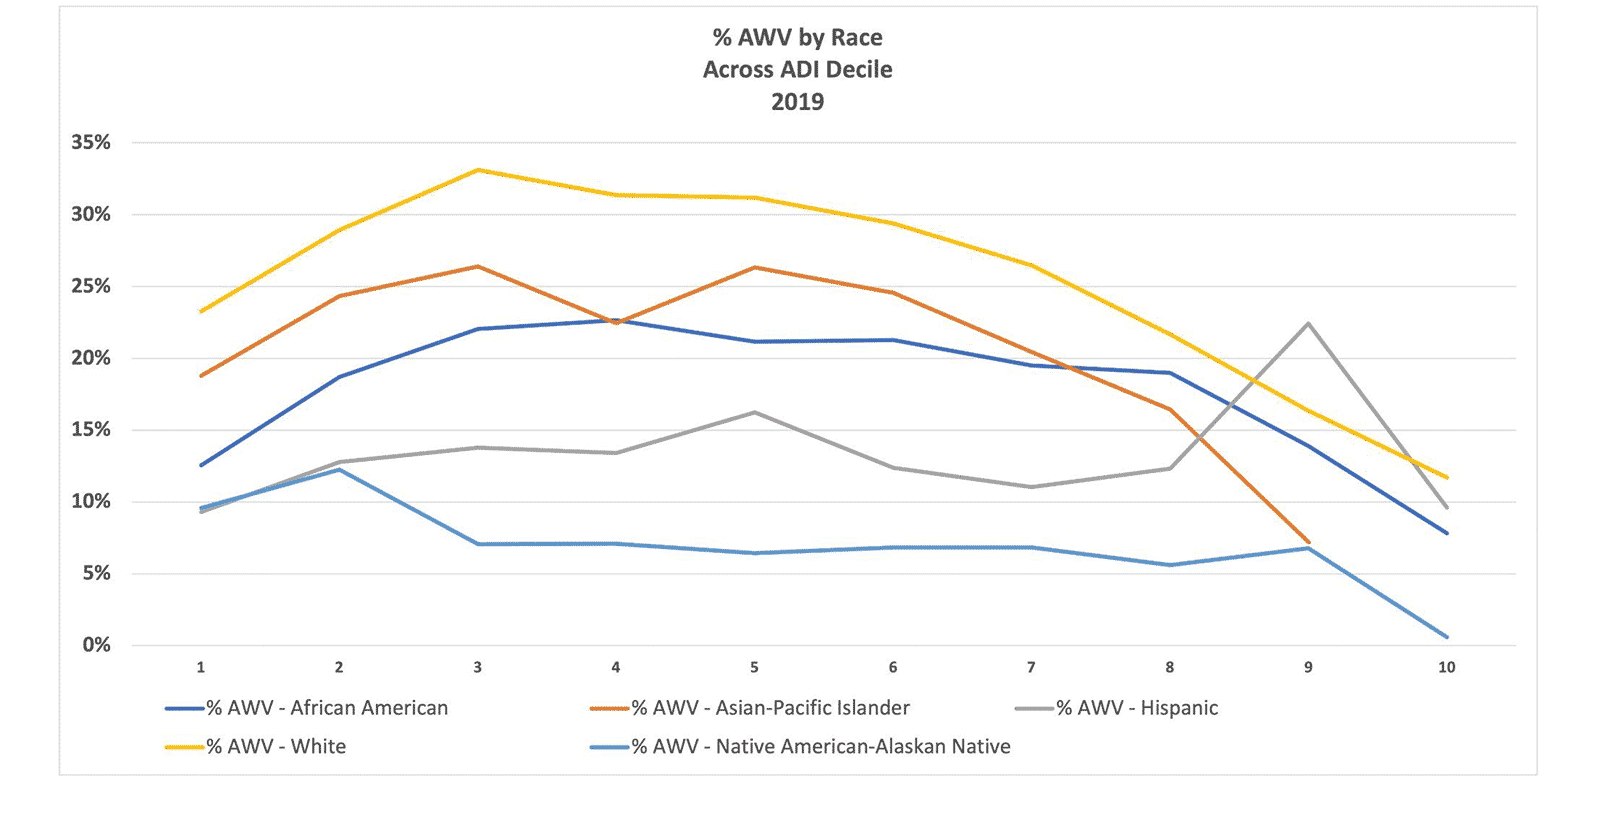
Wellness/Prevention: Medicare covers one Annual Wellness Visit for every beneficiary, promoting primary prevention through regular patient engagement with their PCP for risk assessment, education, and screenings. An ACO working to improve health equity may seek to identify geographies or cohorts with low AWV compliance in order to focus on delivering more accessible non-emergency care to these difficult-to-reach patients.

Data Source: CareJourney
We hope that this post has helped you understand healthy equity and how it can be evaluated among your population using healthcare analytics. See the related resources below for more information on health equity. To discuss how CareJourney can help you evaluate health equity initiatives, request a demo.
