Introduction
Although research has shown that a person’s health outcome is closely related to the social and environmental backgrounds they live and interact with, questions around how social factors impact health outcomes have never received copious attention until the country was struck by the COVID-19 pandemic. Data released by the Center for Diseases Control and Prevention (CDC) reveals the COVID-19 hospitalization rate of African Americans and Hispanic/Latino persons is almost 5 times higher than that of white Americans. Similarly, African Americans’ COVID-19 death rate is two times higher than white Americans.1 It’s quite clear that social factors do indeed play a critical role in health outcomes as we continue to see research surfacing these concepts.
The numbers are shocking and concerning. But why? While a significant amount of research has been deployed to understand how social determinants of health (SDOH) impact care variation, we have yet to bring these findings into actionable insights. For stakeholders across the healthcare industry, what can we do to reduce health inequities and deliver timely and high-quality care to patients who are in most need? This blog answers questions on existing research, use cases, and data collection, presenting reasons why we should continue to invest in SDOH. Using 2019 full-year Medicare Fee for Service (FFS), our analysis reveals SDOH areas that are key to continue reforming care delivery models and enhance care quality.
What is SDOH?
According to the CDC, SDOH is “conditions in the places where people live, learn, work, and play that affect a wide range of health risks and outcomes.”2
Depending on where we live, health can be adversely impacted by the high rate of violent crimes, poor air or water quality, noise, substandard housing quality, lack of access to playgrounds, gyms, or grocery stores in the community. Sociologist William Julius Wilson suggests that living in neighborhoods deeply affected by concentrated poverty can impact a variety of individual outcomes, including violence, tobacco and alcohol use, drug use, economic instability, and overall health.3 For instance, a study assessing characteristics of the asthma population in Georgia finds that asthma is most prevalent among African Americans, women, and persons with less than high school educational attainment, annual household income under $25,000, and living in rural areas.4
Where we live also affects how we behave. “Unhealthy areas smoke more, drink more, and eat to excess; healthier areas avoid these behaviors.”5 Likewise, using Medicaid FFS data, research shows moving from a less healthy location to a healthier location creates a positive effect on life expectancy.6 Further, whether or not a place has favorable life expectancy is associated with access to high-quality care, crime rates, socioeconomic status, and climate.7
As determining factors of population health are intricately interwoven, one can’t expect to enhance population health outcomes by solely investing in medical care. Study indicates that medical care only accounts for around 20 percent of the variation in health outcomes for a population whereas the 80 percent can be traced back to the SDOH.8 According to the County Health Ranking model, determinants of health outcomes are broken down into the following categories (see Figure 1).
Figure 1.
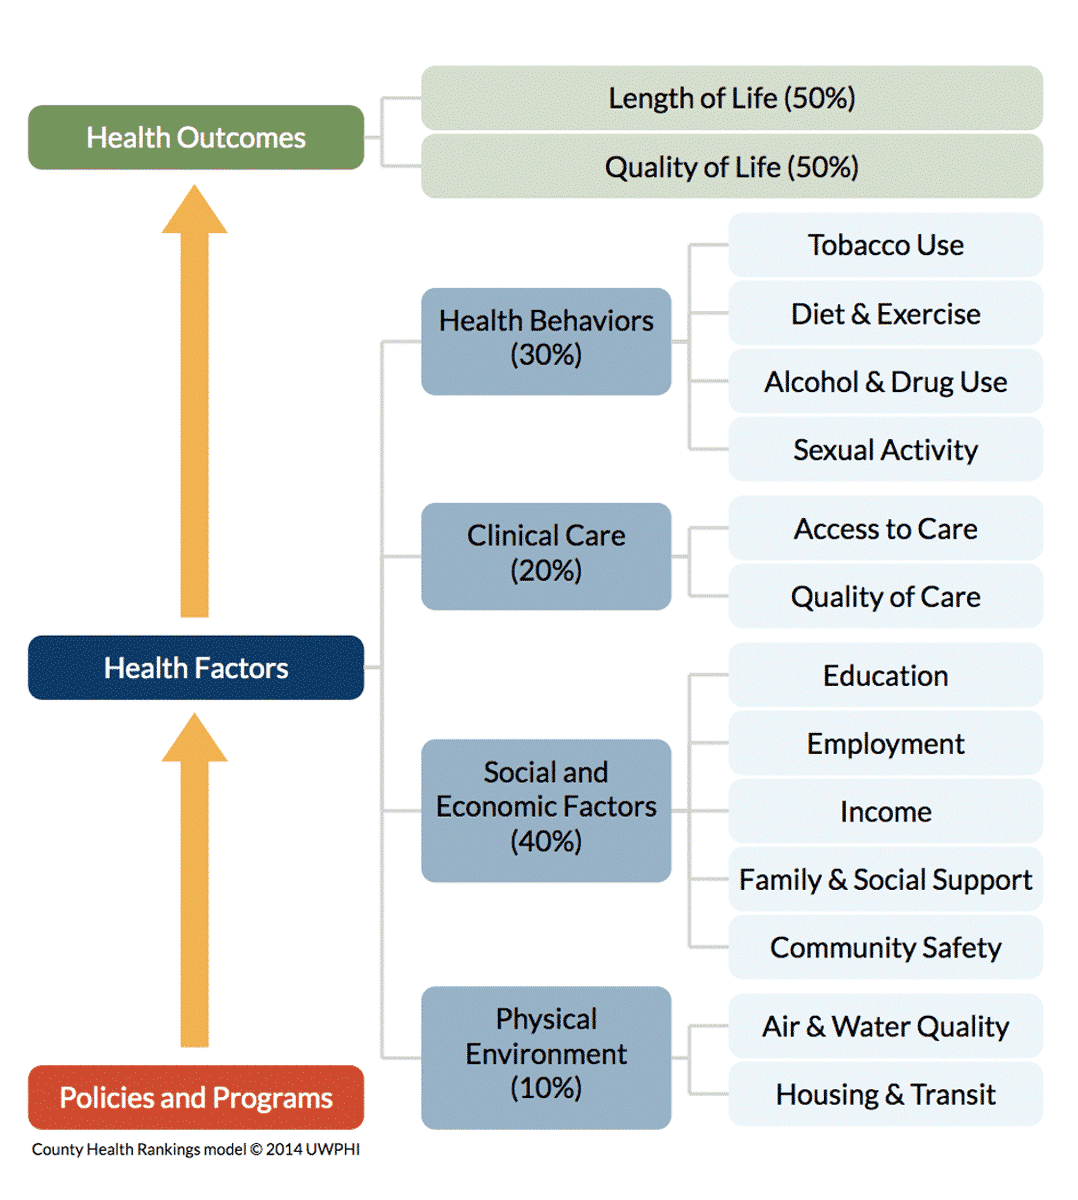
Source: Measures & Data Sources | County Health Rankings Model. County Health Rankings & Roadmaps. Accessed September 8, 2020.
Our Analysis
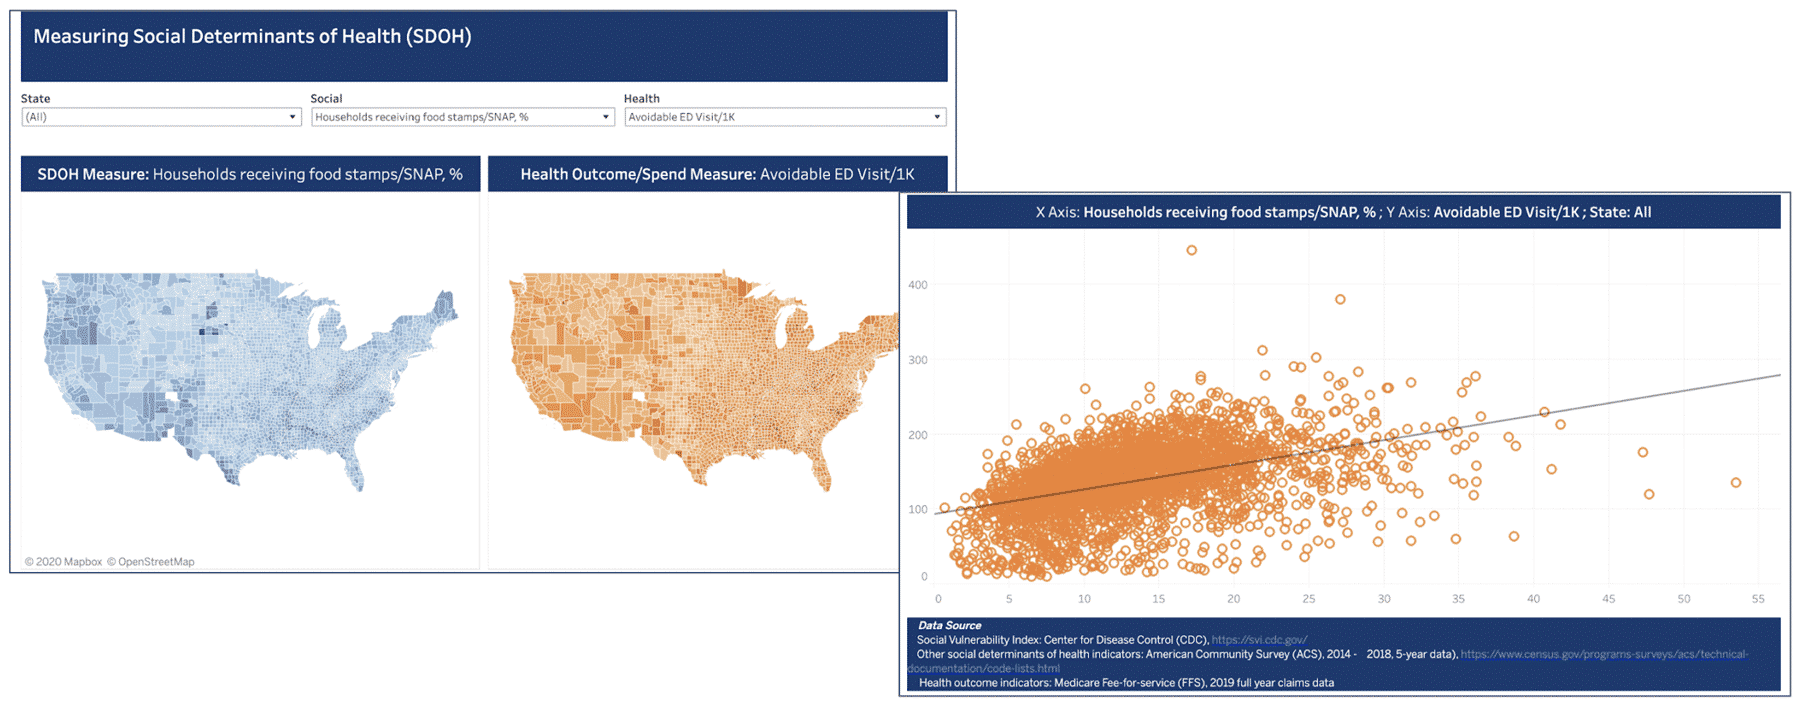
Using 2019 full-year Medicare FFS data and 2014 – 2018 5-year data from American Community Survey (ACS), our analysis explores the relationship between SDOH and common care utilization and outcome metrics at the county-level (See Figure 2). Fill in the form to view the report!
For SDOH measures, we chose the following indicators addressing seven areas:
- Overall Social Vulnerability
- Educational Attainment
- Socioeconomic Status
- Transportation
- Housing
- Food access
- English as a second language
For care metrics, we chose to measure prevalence of common chronic conditions (i.e. hypertension, diabetes, asthma), care utilization (i.e. readmission and avoidable Emergency Department visits), and cost of that care (i.e. PMPY). These metrics have shown to be correlated with SDOH.
Figure 2.
Findings
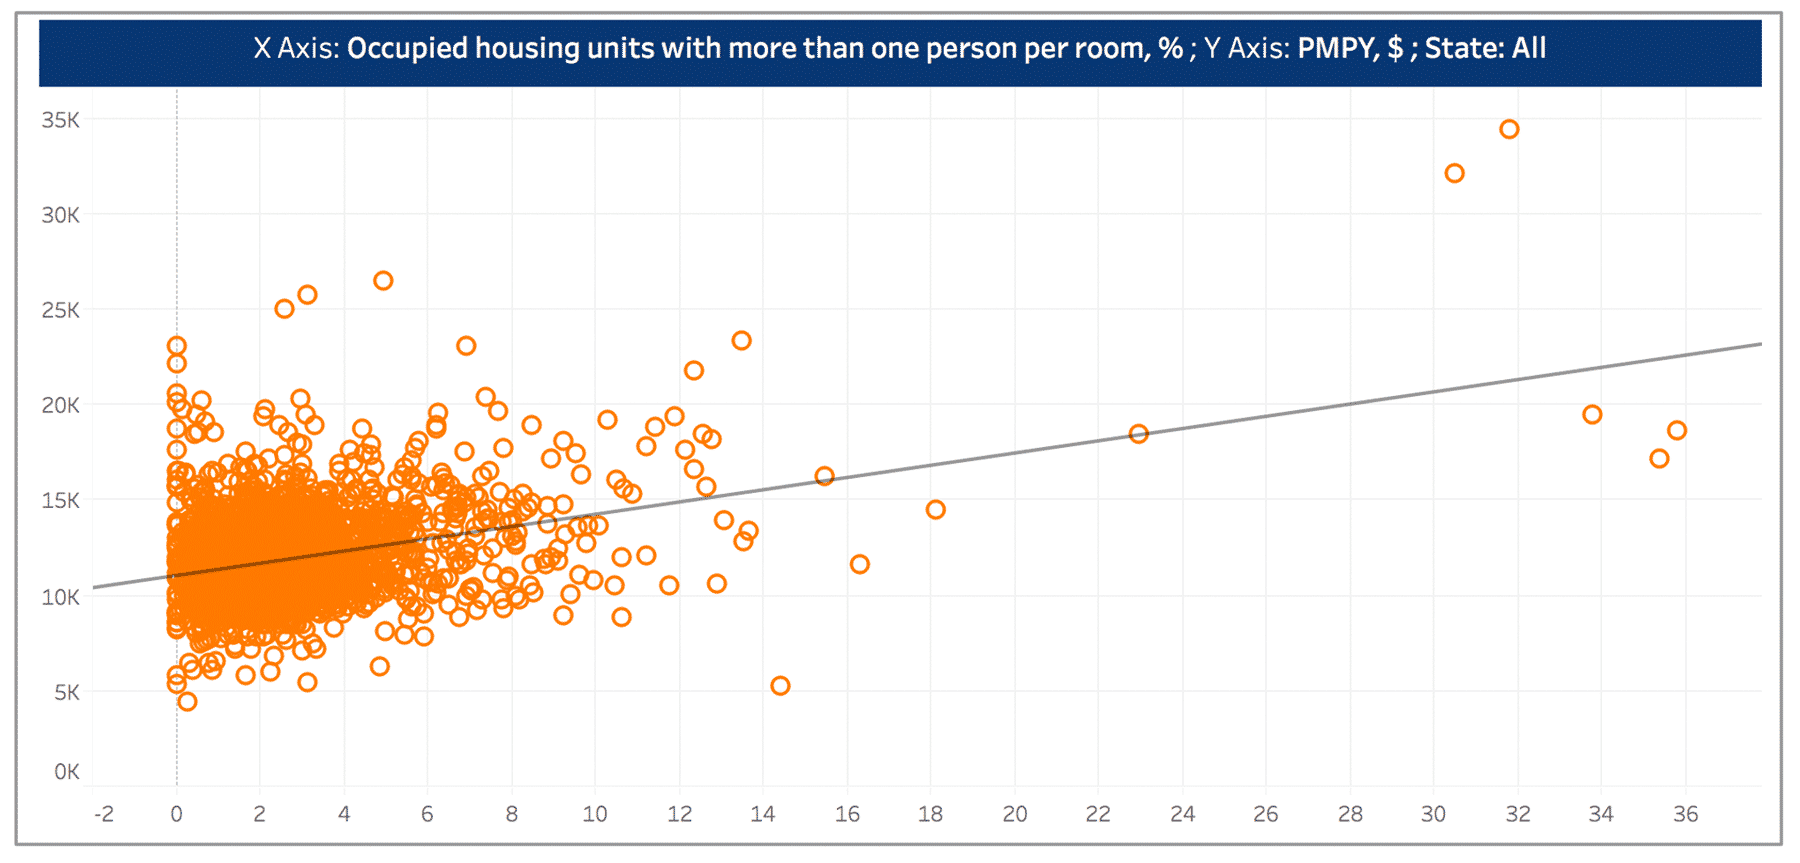
While we expect to see the correlation between household crowding (measured using percent of occupied households with more than one person per room) to be positively correlated with avoidable ED rate, the relationship is not as significant as between household crowding and per member per year (PMPY) spending or readmission rate (see Figure 3 and Figure 4).
The correlations might be explained by patients not receiving adequate preventive or follow up care. Patients may end up being readmitted due to poor living conditions, which impede their ability to take care of themselves, and therefore, drive up the total cost of care. For stakeholders who are interested in tackling low-quality care and high cost for this particular patient group, they should consider enhancing primary care coordination to ensure post-discharge follow-up, and remind these patients to receive preventive care measures (such as Annual Wellness Visits and flu shot) in a timely manner.
Figure 3.
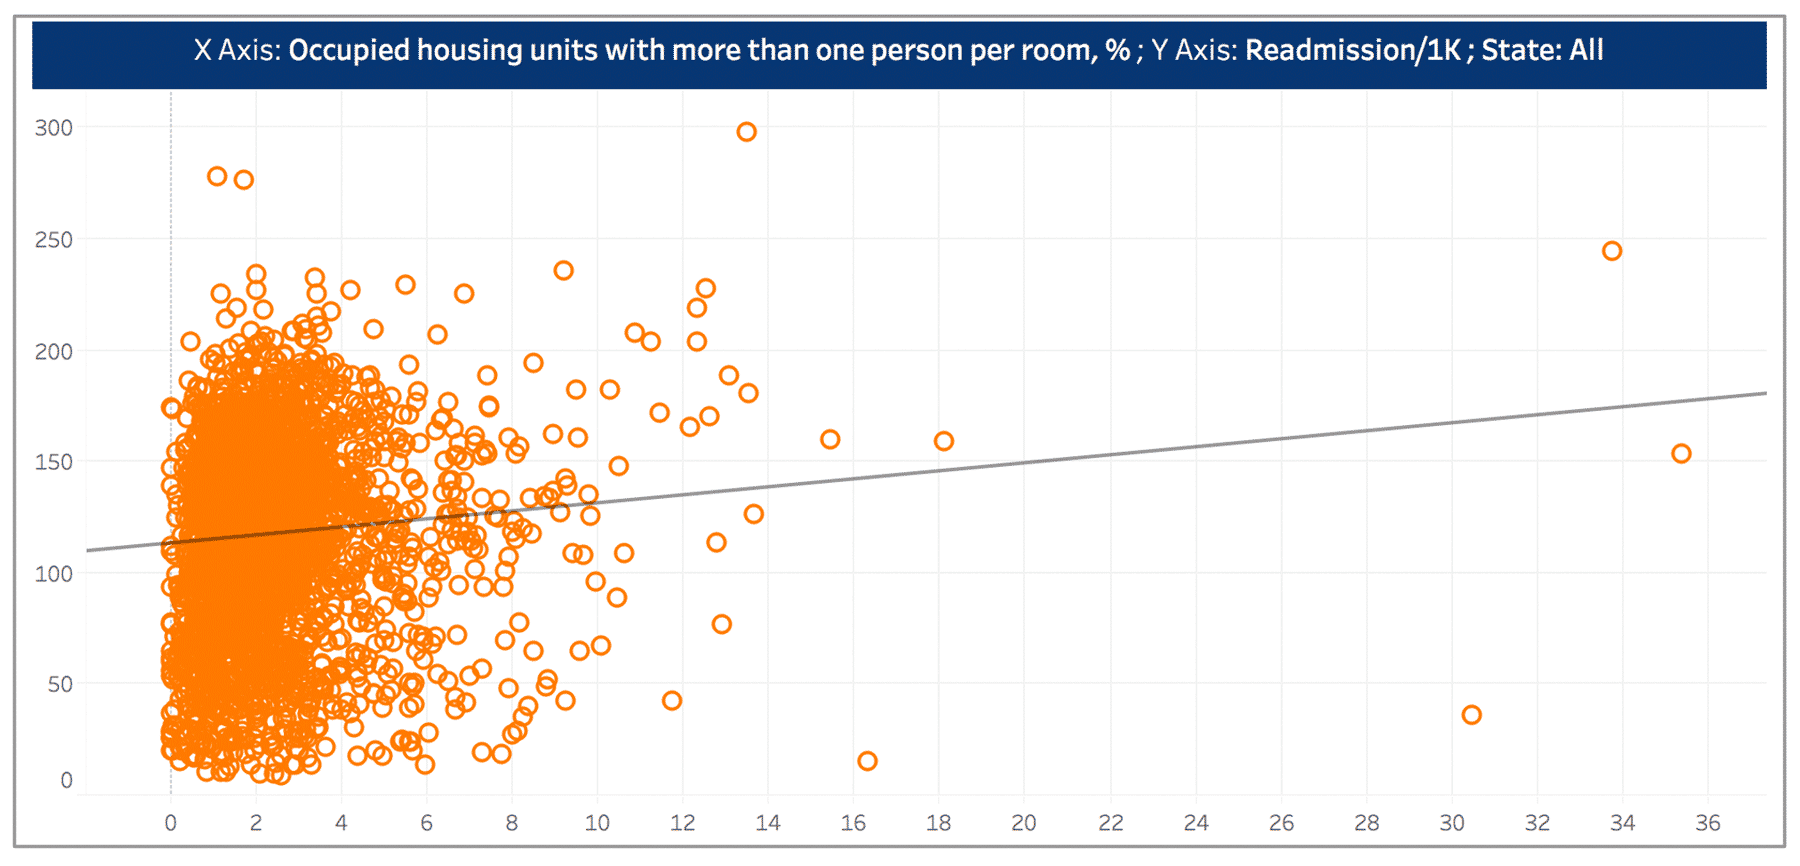
Figure 4.
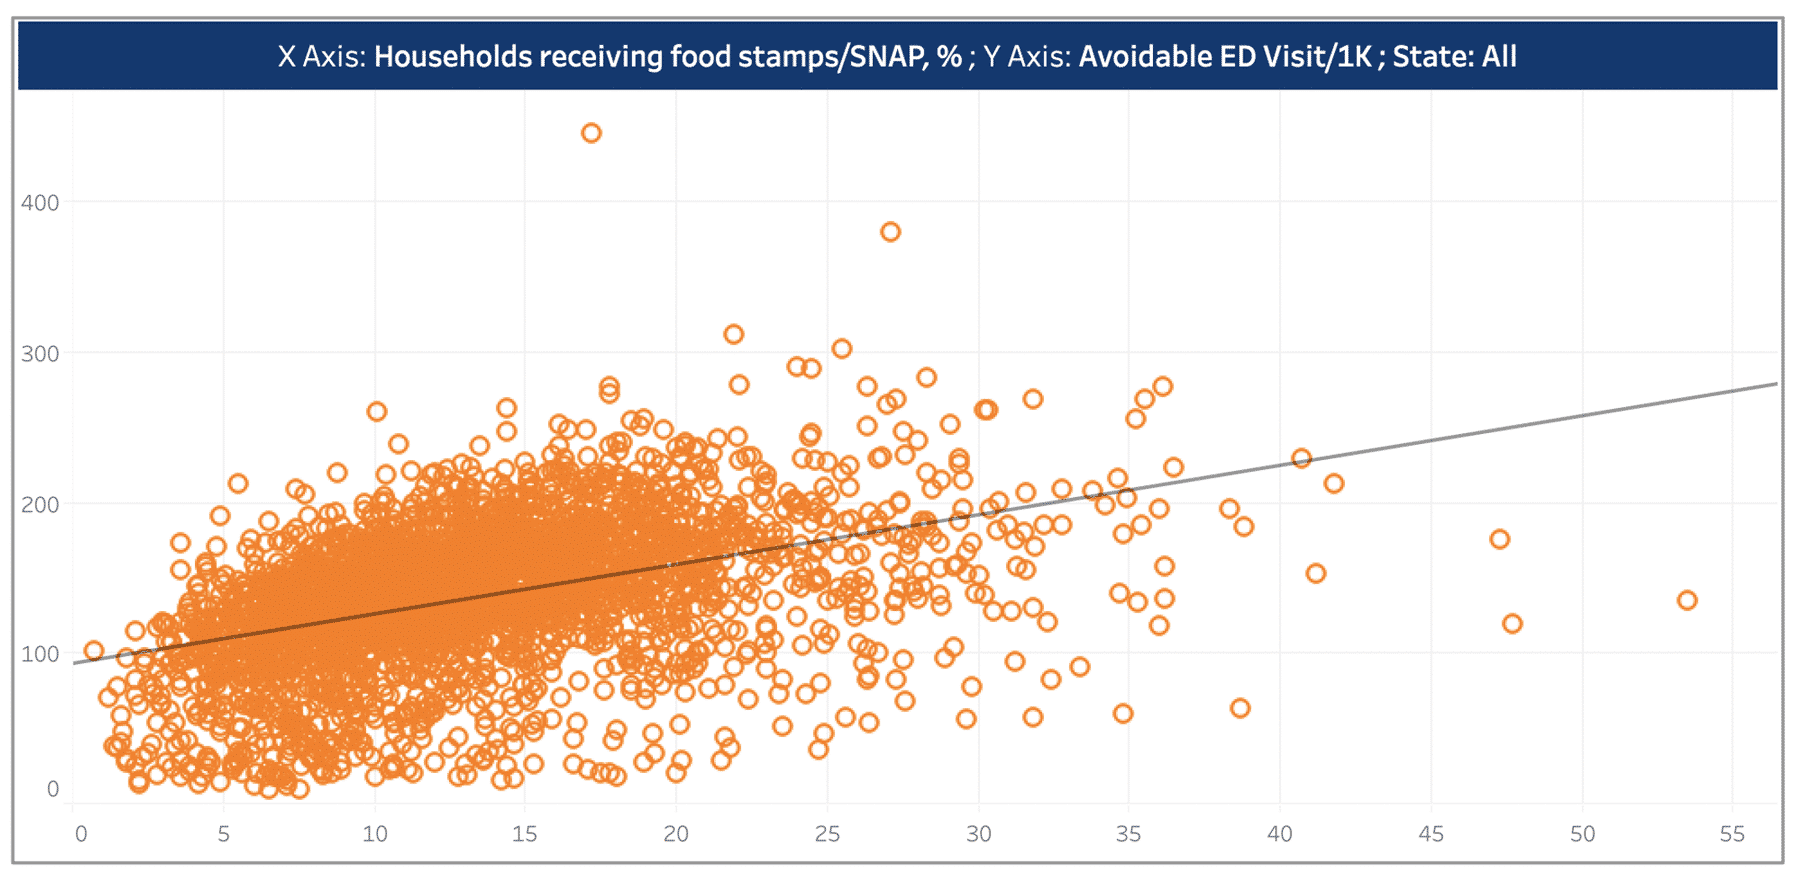
The rate of avoidable Emergency Department (ED) visits is positively associated with percent of households receiving food stamps (see Figure 5). The upward trend can be attributed to patients who are food insecure are more likely to go to ED for meals. Another research, using Missouri SNAP and Medicaid data, suggests that generous food stamps can benefit households through decreasing nutritional fluctuation in quantity and quality of food, which results in fewer ED visits for hypoglycemia. In order to decrease the high ED visit rates for patient groups that lack stable access to food, stakeholders should consider partnering with local grocery stores, soup kitchens, meal centers, and other social services.9
Figure 5.
Why Invest in SDOH?
For Providers
For health systems and physicians, understanding the patients you are treating should go beyond doctors’ offices (and most recently tele-visits). In the pilot results from the Health in Community Survey (HCS), more than one-third of respondents reported that they do not have enough resources for food, transportation, and covering medical bills, while 41.6% reported their primary care doctors were rarely aware of their struggles.10
Having SDOH data informs providers to consider other challenges patients are facing that could deteriorate their health, and create treatment plans closely aligned with patients’ social needs. For example, a primary care provider’s lack of understanding with respect to patients living in poverty can result in prescribing unaffordable medications, which inevitably leads to medication non-adherence and worsening of patients’ health.
Given the structure of value-based payment models, Accountable Care Organizations (ACOs) are encouraged to address SDOH. As ACOs are paid based on outcomes and savings, it is in their interest to undertake SDOH related interventions. Common social determinants ACOs address are transportation, housing, and food. Nonetheless, ACOs face challenges when integrating SDOH interventions into care management.
Study results indicate that the scarcity of data on patients’ social determinants and available community resources hinders ACOs’ ability to take actionable steps.10 Further, most partnerships between ACOs and community programs are in early developmental stages and have not shown promising results. Concerns over the time it will take to see the return of investment also slow down ACOs’ plan to implement SDOH intervention.12
For Payers
Investment in SDOH enables payers to optimize network design, improve network performance through better allocation of resources to address specific social needs of specific populations.
As the Center for Medicare and Medicaid Services (CMS) moves to tackle SDOH, Medicare Advantage (MA) plans are allowed to provide coverage of supplemental benefits to chronically ill patients. The program, Supplemental Benefits for the Chronically Ill (SSBCI), covers a wide range of items and services to address chronically-ill patients’ SDOH, such as air conditioners, meals, counseling, and home remodeling that will improve or maintain the health of the beneficiary.13
A systematic review of the literature examining the effectiveness of investments in care interventions that integrate social services indicates that 82% of these investments resulted in a statistically significant impact in improving health outcomes, reducing care costs, or both. Program investments in housing, income, food, coordinated care, and partnership with community resources show positive impacts on health outcomes and decreased health spending.14
While it may take longer than expected to see the positive return on SDOH investments, evidence has shown the effectiveness of SSBCI. Humana’s Bold Goal program, which addresses individuals’ physical well-being as well as SDOH, reports that their MA members have seen improvement in population health and a decrease in Unhealthy Days (Unhealthy Days measures patient self-reported physically and mentally unhealthy days over 30 days).15 If you want to learn more about SSBCI, click here to replay CareJourney’s webinar, the Personalized MA Era: Optimizing Supplemental Benefits for Chronically Ill Beneficiaries (SSBCI), featuring Caroline Coats, Vice President of Humana’s Bold Goal & Population Health Strategy.
For Life Sciences
Life sciences also play a pivotal role in SDOH.
Integrating SDOH data into the workflow can tremendously benefit life sciences stakeholders in assessing potential market expansion opportunities by identifying unmet social needs and health conditions that largely hinge upon social determinants of the population of interests.
For existing markets, leveraging SDOH data can aid life sciences to evaluate medical non-adherence caused by social determinant attributes, and identify strategies to close the non-adherence gap. An analysis projects that medication non-adherence potentially results in a $250 billion loss in revenue for U.S. pharmaceuticals.16
SDOH are the main predictors of medication access barriers.17
Patients living in rural areas have increased difficulty in access to medications. Patients living in disadvantaged communities with no vehicles face barriers to refill their medications on time. For patients whose first language is not English, they may face challenges sticking with their medications ascribed to confusion about the medications caused by language barriers.
It is in life sciences best interest to invest in SDOH and capture lost revenues in medication non-adherence.
Medication non-adherence also presents opportunities to pharmacies within distressed communities to partner with local providers and healthcare stakeholders to address SDOH. Through analyzing Medicare Part D prescription claims data of each individual pharmacy in the country, CareJourney’s recent blog, Opioid Epidemic, Part 2: The Pharmacy Impact, discusses the decisive influence pharmacists play in the opioid crisis and how different segments of the healthcare industry should collaborate to understand patients’ total health of care.
SDOH Analytics Access
Interested in how CareJourney’s SDOH analytics can help you improve patient outcomes?
Different Types of SDOH Data
Z Codes, Documentation via EHR
Hospitals and clinics are finding different ways to screen their patient’s social needs. One of the tools that is available to capture a patient’s social determinants of health data is the Z code. Z codes are a group of ICD-10-CM codes, which are non-medical factors that identify a patient’s socioeconomic status that have influenced a patient’s health condition.18
Besides physician documentation of Z codes, there is also the adoption of SDOH through electronic health records (EHR). However, Z codes and the adoption of EHRs are not widely utilized as a consequence of the lack of clarity on who can document a patient’s social needs and physicians’ unfamiliarity with Z codes. Another reason is the documentation process being time-consuming, especially when no follow-up was planned, which removes the incentives for documenting.19
Publicly Available Data
On account of the limitations evaluating SDOH impact using Z code and EHR data, CareJourney’s SDOH is powered by publicly available data. Two widely used SDOH measures are the Social Vulnerability Index (SVI), developed by the CDC to help emergency response planners and public health officials identify and map communities that will most likely need support before, during, and after a hazardous event,20 and Area Deprivation Index (ADI),21 developed by the University of Wisconsin Department of Medicine. Both indexes leverage data from ACS released by census and are available at multiple geographic levels. The table below details the variables comprising the indexes.
| ADI | SVI | |
|---|---|---|
| Domain | Variable | Variable |
| Education | Receive less than 9 year of education | No high school diploma |
| With high school diploma | ||
| % Employed population aged 16 years or older in white-collar occupations | ||
| Income/Employment | Median family income | |
| Income disparity | ||
| Below federal poverty level | Below federal poverty level | |
| Unemployed | ||
| Housing & Transportation, Household characteristics | Median home value | Aged 65 or older |
| Median gross rent | Aged 17 or younger | |
| Median monthly mortgage in US dollars | Older than age 5 with a disability | |
| Owner-occupied housing units | Multi-unit structure | |
| Occupied housing units without complete plumbing | Mobile homes |
Explore with CareJourney
CareJourney’s SDOH analytics are powered by SVI, ADI, and ACS data, measuring a wide spectrum of SDOH attributes at various geographic levels (i.e. state, county, CBSA, zip code), including but not limited to, food security, housing, poverty, income, education, transportation, and social isolation.
There are multiple ways in which CareJourney can help leverage SDOH analytics to better improve support of the patient in their healthcare journey:
- Discover specific cohorts of patients with particular SDOH attributes
- Map med-nonadherence pattern to social determinants data
- Generate SDOH risk insights of your attributed populations
- Identify network inadequacies using SDOH data
- Discover market expansion opportunities guided by SDOH insights
- Bridge SDOH data of your population of interest with community resources data
- Identify particular SDOH attributes that are key to your patient population
Data for this analysis comes standard as part of CareJourney’s Cohort Atlas platform, which enables you to dive into any geographic region to understand specific patient segments and sub-segments in that market. CareJourney’s Network Advantage tool offers you insights of your providers’ attributed patients.
If you are currently a member and interested in how CareJourney’s SDOH analytics can help you optimize patient outcomes and lower avoidable spending, please reach out to your Member Services analyst for more information. If you’re not a CareJourney member, email us at jumpstart@carejourney.com, or you can learn more by requesting a meeting below.
- CDC. Coronavirus Disease 2019 (COVID-19). Centers for Disease Control and Prevention. Published February 11, 2020. Accessed September 8, 2020. https://www.cdc.gov/coronavirus/2019-ncov/covid-data/investigations-discovery/hospitalization-death-by-race-ethnicity.html
- About Social Determinants of Health (SDOH). Centers for Disease Control and Prevention. Published August 26, 2020. Accessed September 8, 2020. https://www.cdc.gov/socialdeterminants/about.html
- Wilson WJ. The Truly Disadvantaged: The Inner City, the Underclass, and Public Policy, Second Edition. University of Chicago Press; 2012.
- Ebell M, Marchello C, O’Connor J. The burden and social determinants of asthma for adults in the state of Georgia. J Ga Public Health Assoc. 2017;6(4):426-434. doi:10.21633/jgpha.6.406
- Cutler DM. The school-first solution. Politico. Accessed September 8, 2020. http://politi.co/2mnNZ9H
- Finkelstein A, Gentzkow M, Williams HL. Place-Based Drivers of Mortality: Evidence from Migration. National Bureau of Economic Research; 2019. doi:10.3386/w25975
- Finkelstein A, Gentzkow M, Williams HL. Place-Based Drivers of Mortality: Evidence from Migration. National Bureau of Economic Research; 2019. doi:10.3386/w25975
- Hood CM, Gennuso KP, Swain GR, Catlin BB. County Health Rankings: Relationships Between Determinant Factors and Health Outcomes. Am J Prev Med. 2016;50(2):129-135. doi:10.1016/j.amepre.2015.08.024
- Heflin C, Hodges L, Mueser P. Supplemental Nutrition Assistance Progam benefits and emergency room visits for hypoglycaemia. Public Health Nutrition. 2017;20(7):1314-1321. doi:10.1017/S1368980016003153
- Iezzoni LI, Barreto EA, Wint AJ, Hong CS, Donelan K. Development and preliminary testing of the health in community survey. J Health Care Poor Underserved. 2015;26(1):134-153. doi:10.1353/hpu.2015.0023
- Murray GF, Rodriguez HP, Lewis VA. Upstream With A Small Paddle: How ACOs Are Working Against The Current To Meet Patients’ Social Needs. Health Affairs. 2020;39(2):199-206. doi:10.1377/hlthaff.2019.01266
- Murray GF, Rodriguez HP, Lewis VA. Upstream With A Small Paddle: How ACOs Are Working Against The Current To Meet Patients’ Social Needs. Health Affairs. 2020;39(2):199-206. doi:10.1377/hlthaff.2019.01266
- Kathryn Coleman, CMS. Implementing Supplemental Benefits for Chronically Ill Enrollees. Published online April 24, 2019.
- Taylor LA, Tan AX, Coyle CE, et al. Leveraging the Social Determinants of Health: What Works?. PLoS One. 2016;11(8):e0160217. Published 2016 Aug 17. doi:10.1371/journal.pone.0160217
- Jessica Kent. Humana Sees Population Health Gains for Medicare Advantage Members. HealthPayerIntelligence. Published April 24, 2019. Accessed September 8, 2020. https://healthpayerintelligence.com/news/humana-sees-population-health-gains-for-medicare-advantage-members
- Medication Adherence: Pharma’s $637 Billion Opportunity – HealthPrize Technologies. HealthPrize. Accessed September 8, 2020. https://healthprize.com/blog/medication-adherence-pharmas-637-billion-opportunity/
- Medication Access Framework for Quality Measurement. Pharmacy Quality Alliance. Published March 7, 2019. Accessed September 8, 2020. https://www.pqaalliance.org/medication-access-framework
- ICM-10-CM Coding for Social Determinants of Health. American Hospital Association. https://www.aha.org/system/files/2018-04/value-initiative-icd-10-code-social-determinants-of-health.pdf
- Gold R, Bunce A, Cowburn S, et al. Adoption of Social Determinants of Health EHR Tools by Community Health Centers. Ann Fam Med. 2018;16(5):399-407. doi:10.1370/afm.2275
- The Social Vulnerability Index (SVI): Fact Sheet | CDC. Centers for Disease Control and Prevention. Published September 10, 2018. Accessed September 8, 2020. factsheet.html
- Kind AJH, Buckingham WR. Making Neighborhood-Disadvantage Metrics Accessible — The Neighborhood Atlas. N Engl J Med. 2018;378(26):2456-2458. doi:10.1056/NEJMp1802313
