On March 31, 2023, Centers for Medicare and Medicaid Services (CMS) released the annual 2024 Medicare Advantage and Part D Rate Announcement (Rate Notice), which is the final guidance on rates for Medicare Advantage in 2024. As we explained in our prior blog posts (here and here), one of the more substantial changes proposed for Medicare Advantage in 2024 is in the way risk scores are calculated.
As a very brief primer, risk scores are one of the key elements for determining how much money a Medicare Advantage payer will receive for a beneficiary. Risk scores reflect both the demographics of the beneficiary in the demographic relative factors and the illness burden of the beneficiary in the disease relative factors. A beneficiary has a higher risk score if they have a higher illness burden. Risk scores are intended to project how much a beneficiary will cost in a performance year.
In 2023, CMS is using version 24 of its CMS-Hierarchical Condition Categories (CMS-HCC) Risk Adjustment Model. The new model is named version 28 and contains changes both to the diagnosis codes that feed into HCC categories that add to the risk score as well as changes to the values of HCCs. In our prior analysis, we found that overall risk scores would decrease by 0.41%, but that risk scores for minorities decreased by 1.62% and risk scores for beneficiaries dually eligible for Medicare and Medicaid decreased by 1.81%.
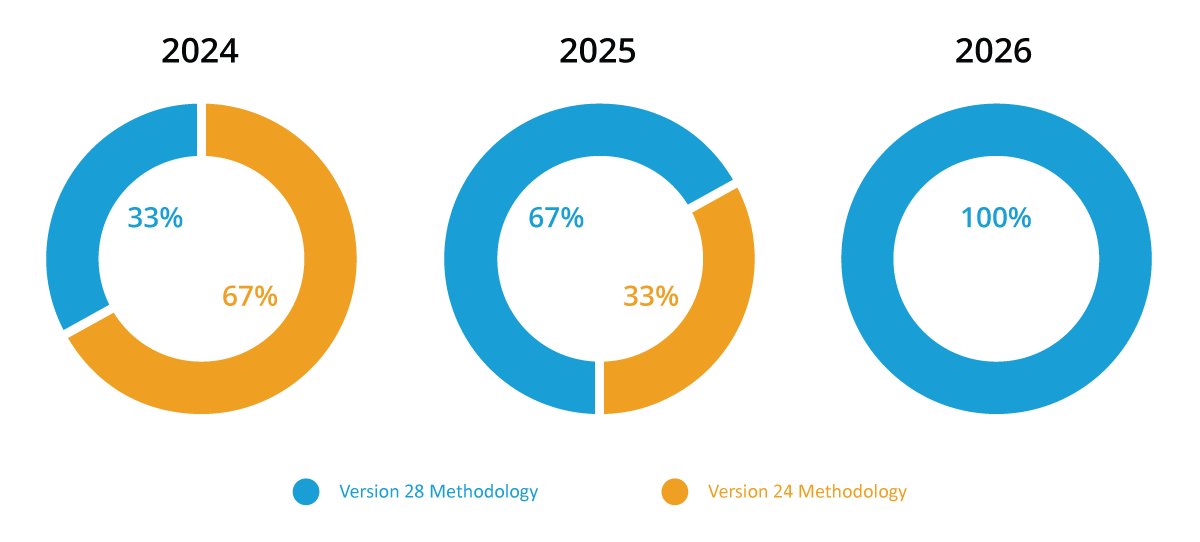
Initially, CMS proposed moving solely to version 28 in 2024, but after receiving many comments with concerns about the effects of the changes to the model, CMS has decided to phase in version 28 over the next few years using a blending methodology. For 2024, risk scores will consist of 67% version 24 risk scores and 33% version 28 risk scores. In 2025, version 28 will account for 67% of the risk score with 33% remaining version 24, and version 28 will be fully implemented for 2026 risk scores.
Blended Risk Score Methodology

The impacts to risk scores utilizing this blended methodology amongst our prior demographic groupings can be seen in the chart below.
| Bene Demographic | Normalized v.24 | Normalized v.28 | Blended Risk Score 2024 | % Difference |
|---|---|---|---|---|
| All Benes | 1.131 | 1.126 | 1.130 | -0.13% |
| Race | ||||
| White | 1.115 | 1.115 | 1.115 | -0.01% |
| Minority | 1.208 | 1.188 | 1.201 | -0.55% |
| Dual Status | ||||
| Dual | 1.576 | 1.548 | 1.567 | -0.60% |
| Not Dual | 0.999 | 1.002 | 1.000 | 0.08% |
Fig.1. These risk scores were calculated based on 2019 diagnoses and using the 2024 normalization rates for each model as published in the Rate Notice. Duals were dually eligible in any month of 2019.
- Risk scoring is not intended to be used for anything other than predicting beneficiary expenses in a performance year. Many of the comments we have heard, and that CMS received, were concerns regarding diagnosis codes that no longer have a corresponding Hierarchical Condition Code, meaning they will not contribute to the calculation of how much money a beneficiary will cost. We heard from many groups that these codes are used for preventative care and help to slow down or stop the progression of disease. CMS’s response to those concerns is that these codes do not translate into increased spend in the performance year, and that is the sole purpose of the risk scoring algorithm.
- The second point is a variation of the first point: any modifications to the risk scoring algorithm were done based on clinician input, evaluating version 24’s historical performance, and Principle 10 – which states that discretionary diagnosis codes should be excluded from the model. Essentially, CMS says that if a diagnosis code was excluded from version 28’s payment model it is because that diagnosis code was over utilized in Medicare Advantage relative to Fee For Service and clinician input determined it was discretionary and historically that code or that HCC did not equate to actual spend. In short, version 24 of the model overcompensated for certain conditions and version 28 seeks to more accurately predict expenses.
CMS also addressed the concerns that version 28 disproportionately impacts dually eligible beneficiaries and minority beneficiaries by relying again on the purpose of the risk scoring algorithm – to predict expenses, not reimburse for conditions. They explain that risk scores for dually eligible beneficiaries are still higher than non-dual eligible beneficiaries due to an increased demographic relative score, and that special needs plans still have higher average risk scores than non-special needs plans.
How to Understand the Impacts of Version 28 and Integrate Learnings Into Your Broader MA Strategy
As you have seen from the above, and from our previous analyses, it is clear that risk scores will decrease nationally, however all organizations are impacted differently. It is important for organizations to understand where they fall on the spectrum and create a plan to mitigate their impact. Besides understanding the pure decrease of score for your organization, you will want to evaluate the impact at the following levels to get ahead of the curve:
- Demographic Factors (minority and dual status)
- Disease Group and HCC-Level
- Top Impacted Diagnosis Codes (ICD-10s) for the three most impacted disease groups
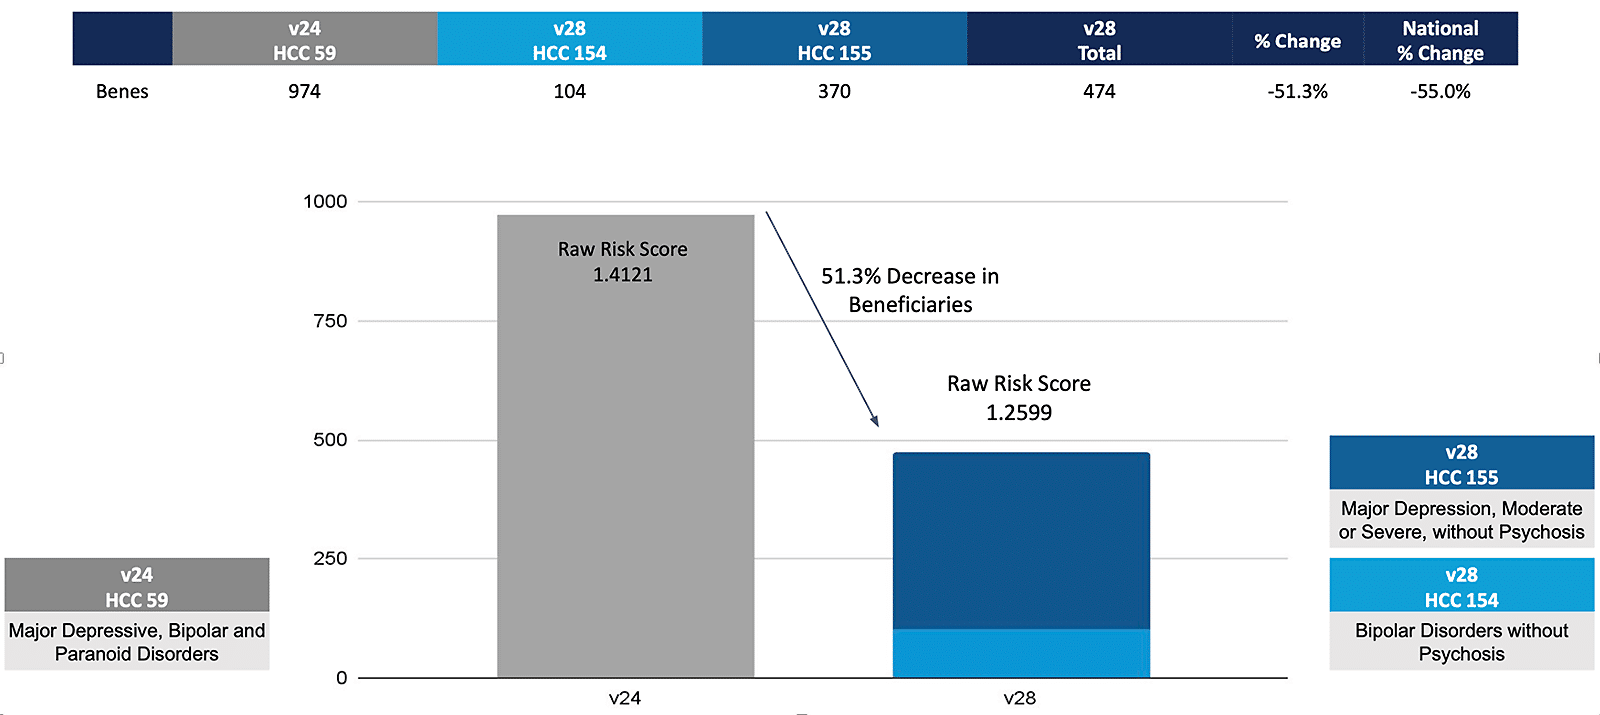
Below is an example of a risk score impact for a sample practice that can be generated using the Disease Group and HCC-Level impact analysis tables. This example is for the depression and bipolar disease group.
Disease Group Impact for Depression and Bipolar at CareJourney Medical Group

While this may seem like an entirely new (and separate) initiative to deal with, it is really just another, albeit vital, component of your broader Medicare Advantage strategy. Below we highlight a few strategic initiatives that our members are focusing on in 2023 and what combination of data you need to accomplish the desired outcome.
Grow Intelligently
To no one’s surprise, a common initiative is growth. Whether you are looking to enter new markets or add practices in existing markets, having data on both the market as a whole and the practices you are considering adding is crucial. There are some common data points that our members look at when evaluating new practices:
- Practice group patient panel, specifically MA:FFS ratio
- Practice group growth compared to the market benchmark
- Payer distribution of MA panel
- Medicare under management trends in the market – Growing MA? Growing value based care? Both?
Risk score impact becomes another metric to add to this evaluation. Uncovering that a practice group has a large HCC prevalence tailwind compared to others in the market may bring them to the top of your list.
Know Your Network
All provider organizations have active performance improvement initiatives (sometimes a handful). In order to make the investments in the appropriate initiatives, organizations need to identify improvement opportunities for existing in-network providers based on their care for all attributed patients. Opportunities are identified by understanding benchmarks and variations in some of the following example metrics:
- IP Admits per 1k
- IP Readmission Ratio
- SNF Admits per 1k
- SNF Average Length of Stay
- ED Visits per 1k
- Avoidable ED Visits per 1k
- Annual Wellness Visit compliance
- Transitional Care Management compliance
- Advance Care Planning compliance
- Flu Vaccine compliance
It is likely that many physicians that have improvement opportunities with some of the above metrics also have an opportunity to improve their HCC coding under v28. Identifying multiple performance improvement opportunities at once allows you to really customize an improvement plan for a physician or physician group. In fact, risk score impact can help identify specific sub-groups that could be better managed.
Manage Referrals
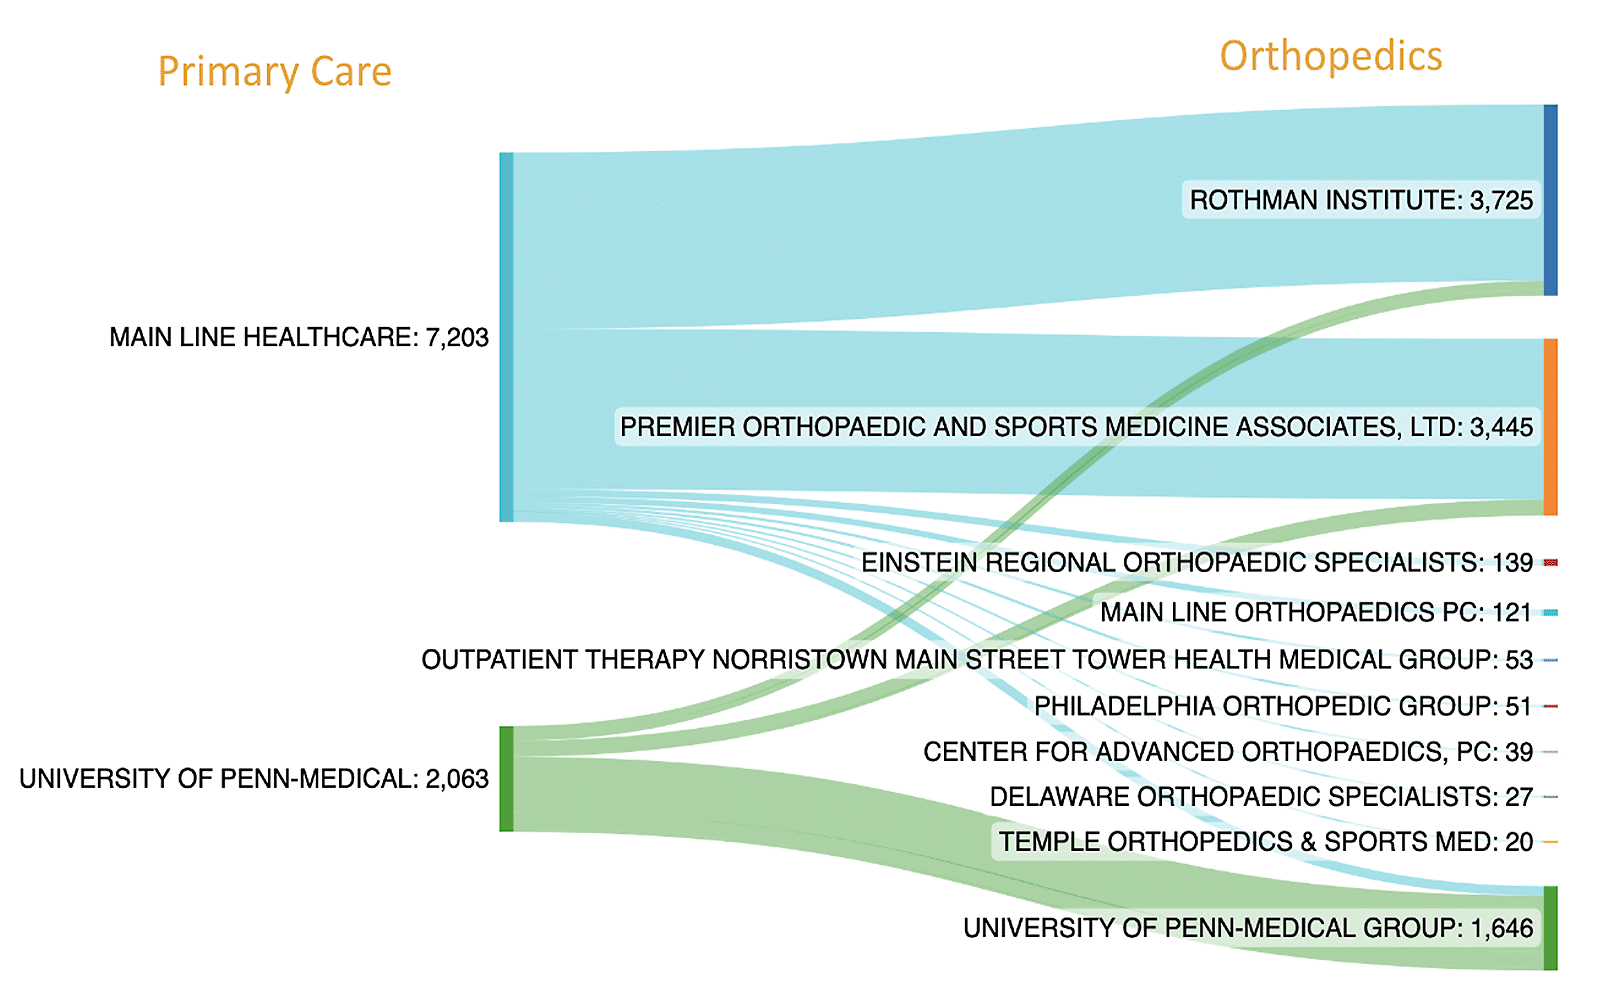
The majority of patient spend is attributed to specialists. Because of that, many organizations make it a priority to establish preferred specialist networks to ensure their patients are being referred to high quality, cost-efficient specialists. It is common practice for organizations to review whether their primary care groups are actually referring to the preferred specialists, or if patients are making their way outside of that network.

The above shows a small sample of Medicare Advantage referrals by two larger primary care groups in the Philadelphia area. While such data points are perfect for confirming patient flow to the appropriate network, you need to further understand if these specialists are appropriately capturing relevant HCCs, or if they need education on the appropriate diagnoses.
If you are interested in how CareJourney data can help enhance your Medicare Advantage strategy, whether specific to v28 or more broadly, join our upcoming webinar Tuesday, April 25 at 1 pm ET as our experts share the implications of these changes for different stakeholders, and how you can prepare for these changes now. We’ll walk through how an example organization will be affected and recommended actions based on their impact. You’ll learn how CareJourney data can help you:
- Understand the normalized risk score & financial impact of v28 for your organization
- Evaluate high volume HCCs and diagnoses driving your impact
- Identify populations that are most impacted by the changes
- Benchmark your impact against the region
