On February 1, 2023, CMS released the Medicare Advantage (MA) Advance Notice which is a document used to give notice to MA plans about upcoming changes to the model for the following performance year. As we outlined in our prior blog post, the Advance Notice contained substantial changes to the risk scoring model. CMS provided the methodology for calculating risk scores (the program code) on February 17, 2023 and CareJourney has spent the last several weeks implementing that code, analyzing the impacts of the new risk scoring methodology along several axes, and partnering with Duke Margolis on a comment letter to reflect on our early findings, including a recommendation to transition to the use of clinical data sourced from certified electronic health records systems to improve model accuracy.
As we spoke to our members, thought partners and current/former policymakers, the common concern about the new model was that it would likely have a greater impact on Medicare Advantage plans that serve a higher population of minority beneficiaries or beneficiaries who are eligible for both Medicare and Medicaid simultaneously (“dual eligible beneficiaries”). In our analysis we looked at these two groupings as well as impacts on beneficiaries residing in “economically distressed” zip codes. We further analyzed the impact of the new model on several disease groups such as diabetes, depression, and congestive heart failure.
Methodology and Definitions
We sought to compare the same set of beneficiaries under both the old version of the risk scoring model (version 24) and the new version of the risk scoring model (version 28). We utilized 2019 diagnoses as those are the most recent Medicare Advantage encounters data made available to researchers that are not impacted by COVID-19. As we explained in our prior blog post, in order to compare version 24 risk scores to version 28 risk scores, they must be “normalized” to account for differences in the methodology. CMS published the “normalization factors” for 2024 for each model. We are using these normalization factors in our analysis so that we can compare the impact between the two versions.
We receive race and dual eligibility data from the Medicare claims database via our research license. In order to determine whether a beneficiary would be categorized as “distressed” we matched their five-digit zip code to the Distressed Communities Index and grouped beneficiaries into quintiles. We categorized quintiles 4 and 5 as “distressed.”
We examined not only the overall impact to risk scores along these lines, but also the impact of each Hierarchical Condition Code (HCC) in an effort to provide additional information to our members and industry stakeholders preparing a response to the Advance Notice. We utilized the mapping file that CMS provided linking diagnosis codes to version 24 HCCs and version 28 HCCs to compare the impact on individual HCCs, grouped by disease groups.
How Will You Be Impacted?
See the v24 to v28 normalized risk score impact for your population, evaluate what high-volume HCCs and diagnoses are driving your impact, and benchmark your impact against the market or competitors.
Summary Findings on Underserved Populations
| Bene Demographic | Normalized v.24 | Normalized v.28 | % Difference |
|---|---|---|---|
| All Benes | 1.13105 | 1.12644 | -0.408% |
| Race | |||
| White | 1.11502 | 1.11468 | -.0300% |
| Minority | 1.20809 | 1.18797 | -1.666% |
| Dual Status | |||
| Dual | 1.57602 | 1.54753 | -1.808% |
| Not Dual | 0.99946 | 1.00191 | 0.246% |
| Distressed Index | |||
| Distressed | 1.21667 | 1.20942 | -0.596% |
| Not Distressed | 1.07394 | 1.07359 | -0.032% |
Fig.1. These risk scores were calculated based on 2019 diagnoses and using the 2024 normalization rates for each model as published in the February 1 Advance Notice. Distressed beneficiaries live in areas with a Distressed Community Index in quintiles 4 or 5. Duals were dually eligible in any month of 2019.
As theorized, we found that these changes to the risk scoring methodology impact dual-eligible beneficiaries and minority beneficiaries more than their non-dual or Non-Hispanic White counterparts. For all Medicare Advantage beneficiaries, we see a 0.408% decrease in risk scores when calculating 2019 encounters under version 28 versus version 24. Risk scores for minorities would have observed a 1.66% decrease under version 28, as compared to Non-Hispanic White beneficiaries who see only a 0.03% decrease under version 28. Beneficiaries who are eligible for both Medicare and Medicaid have risk scores that are 1.808% lower under version 28, whereas beneficiaries who are not Medicaid eligible see a 0.246% increase in their scores under version 28.
Beneficiaries who live in distressed areas were also disproportionately affected, seeing a drop in risk scores of 0.596% as compared to beneficiaries living in non-distressed areas who only had risk scores decreased by 0.032%.
Another way to analyze the impacts of version 28 to specific beneficiary populations is to look at the disparity between a majority population and a minority population under versions 24 and 28. This approach is illustrated in the table below for the dual eligible beneficiaries (minority population) and non-dual eligible beneficiaries (majority population). Looking at the dual eligible population, for example, we see the risk scores for duals in Medicare Advantage calculated using version 24 are 57.7% higher than non-duals. That difference narrows under version 28 such that the duals have a risk score that is only 54.5% higher than non-duals. The average non-dual risk score rises under version 28 compared to version 24, whereas average scores decrease for duals.
Since risk scores are intended to predict expenses for beneficiaries in a performance year, we can look to Fee For Service Medicare to compare what dual-eligible beneficiaries actually cost relative to non-duals. Looking at the difference in costs for beneficiaries in Fee for Service Medicare in 2021, it is clear that dual eligible beneficiaries have expenses that are greater than the differential in Medicare Advantage risk scores under either risk scoring version whether the beneficiaries are enrolled in MSSP or traditional Fee for Service Medicare.
| v.24 HCC | v.28 HCC | 2021 PMPY FFS | 2021 PMPY MSSP | |
|---|---|---|---|---|
| Dual | 1.576 | 1.548 | $19,023 | $18,367 |
| Non-Dual | 0.999 | 1.002 | $10,203 | $11,580 |
| % Difference | 57.7% | 54.5% | 86.4% | 58.6% |
Plan-Level Analysis: Greater Impacts to Plans with Higher Percentage of Dual Eligibles
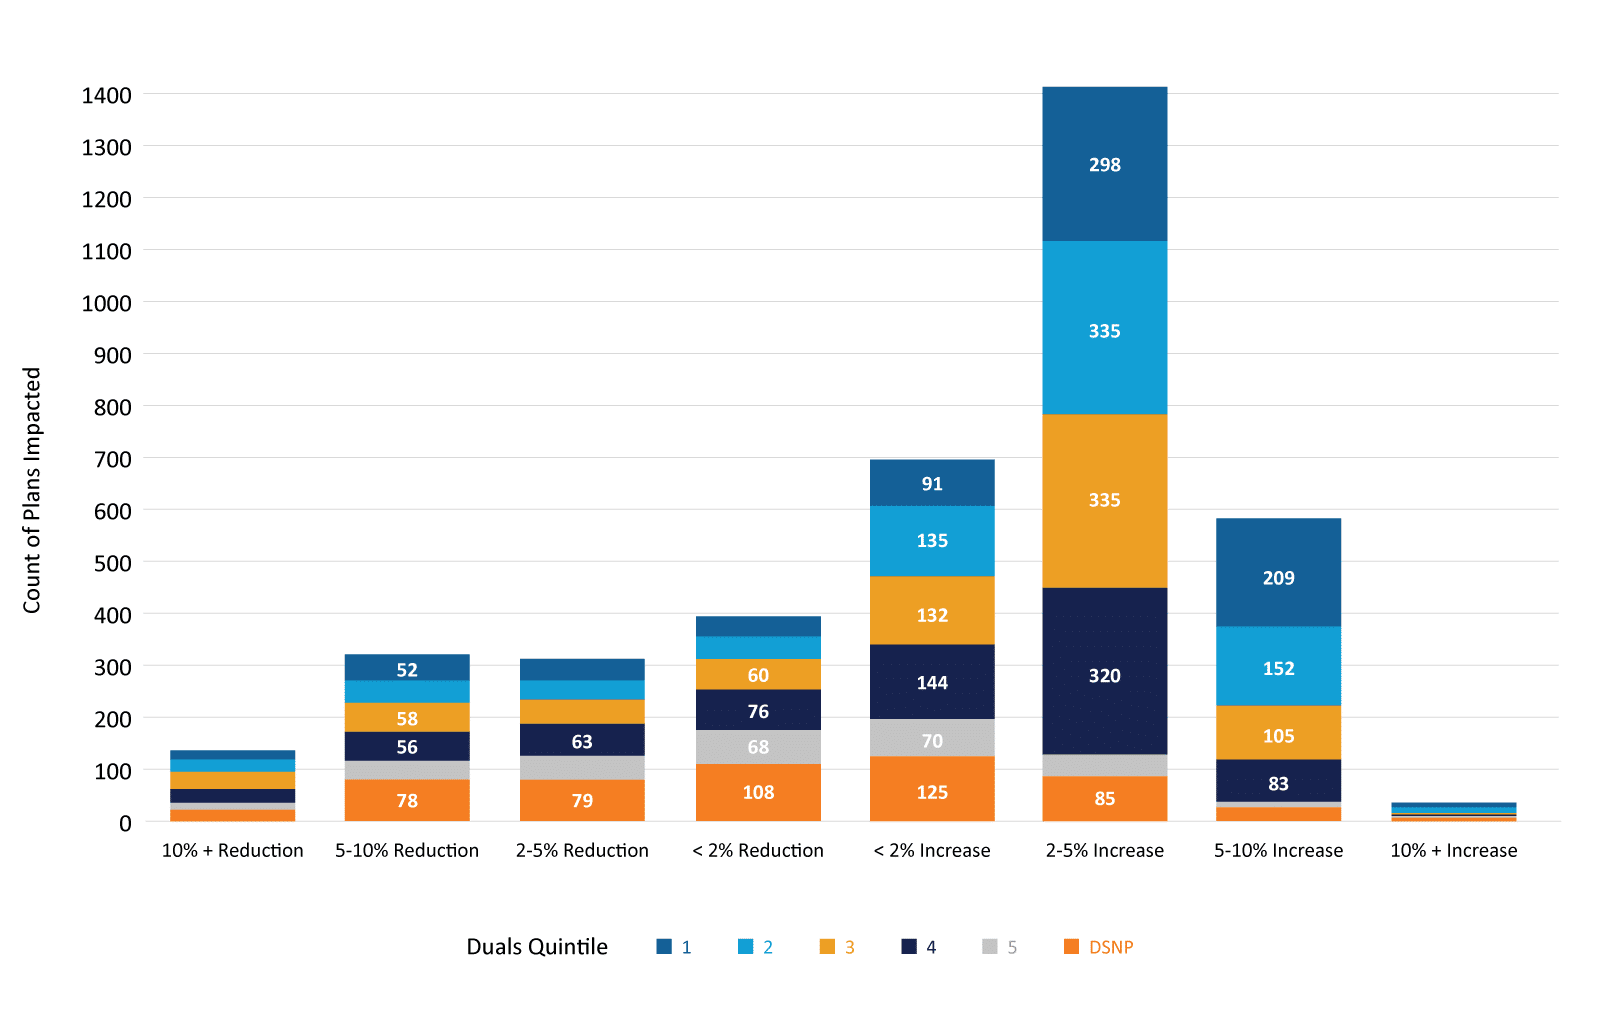
We also looked at how individual plans were impacted, subsetting each plan by what proportion of their enrollees were dual eligible. Using CMS’ Master Beneficiary Summary File, we mapped beneficiaries to plan contracts, individual plans and aggregated them to parent organizations. We then created a percentile ranking by plan of the dual-eligible proportion, then breaking those out into quintiles and indicating whether the plan was a D-SNP (which should be 100% dual enrollment). While the majority of MA plans will actually see an increase in the risk score, D-SNP plans and those in quintiles with higher proportions of dual enrollment were disproportionately impacted by score reductions.
- 77.8% of D-SNP plans and 81.5% of quintile 5 plans had a reduction in their risk score, compared to 31.7% of plans in quintile 1.
- 19% of D-SNP plans and 17.5% of quintile 5 plans had more than a 5% reduction in their risk scores, compared to 9.1% of quintile 1 plans.
ICD-10 Diagnosis Code Change Analysis
As we explained in our prior blog post, one change to the proposed risk scoring methodology involved the removal of almost 2,300 diagnosis codes that feed into the risk scoring algorithm. These codes were previously associated with an HCC in version 24, but in version 28 they are no longer associated with an HCC. This means that beneficiaries having these diagnosis codes are not expected to have any additional costs associated with these diagnoses the following year.
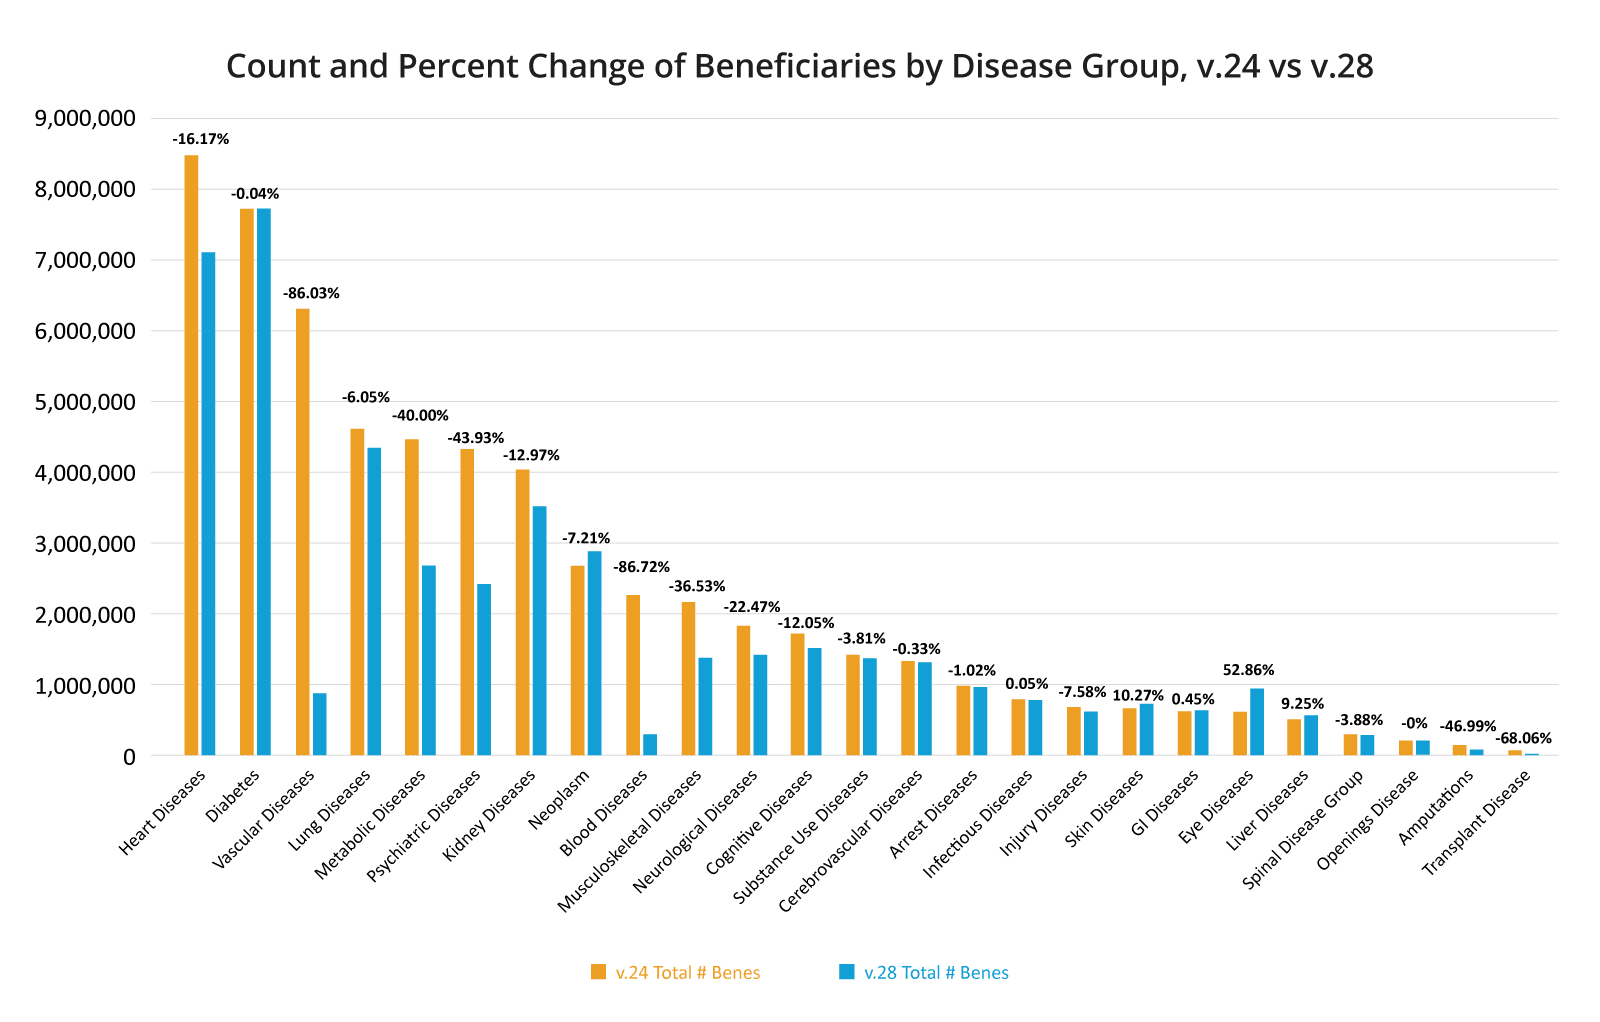
We looked at the shifts in diagnosis codes by disease group to understand where the biggest effects would be seen. In some instances diagnosis codes were also moved from one disease group to another, so it may appear that a disease group lost a sizeable population but in reality they might be accounted for in another disease group.
The disease groups that saw the largest percent drop in beneficiaries were blood diseases (86% decrease), vascular diseases (85% decrease) and transplants (70%) decrease. These were also the same disease groups that saw the largest percentage of the diagnosis codes that feed into the HCCs in the disease group moved to other disease groups, so a portion of these beneficiaries were still given an HCC for the diagnosis, but that HCC now falls under a separate disease group. An example of this is that beneficiaries on a kidney transplant status previously appeared in the transplant disease group but now appear in the kidney disease group.
The disease groups that saw the largest number of diagnosis codes dropped entirely were kidney diseases (86% of codes dropped), amputations (86% of codes dropped), metabolic diseases (76% of codes dropped), and psychiatric diseases (50% of codes dropped).
The psychiatric disease group has caused a particular amount of concern, given the increased mental health disorders the entire population is facing post-COVID. One particular diagnosis code, F330, which is used to diagnose a patient with mild depression, will no longer feed into any HCC, which means that no additional money will flow to patients with mild depression for their treatment. In fact, when we looked at the top 20 dropped diagnosis codes as measured by the resulting “risk score” drop multiplied by the number of beneficiaries affected, mild depression was the fifth most impactful and of the top 20, 3 were some form of depression.
Top 20 Most Impacted Dropped ICD-10 Codes
Number of Affected Beneficiaries x Difference in Resulting HCC Score
- Athersosclerosis of aorta
- Peripheral vascular disease unspecified
- Acute kidney failure, unspecified
- Type 2 diabetes mellitus w/o gangrene
- Major depressive disorder, recurrent, mild
- Thrombocytopenia, unspecified
- Other non-thrombocytopenic purpura
- Major depressive disorder, recurrent, unsp.
- Heart disease, coronary artery, w/ angina
- Angina pectoris, unspecified
- Polyneuropathy in diseases classified elsewhere
- Unspecified protein calorie malnutrition
- Sacroiliitis, not elsewhere classified
- Major depressive disorder, single episode, mild
- Secondary hyperparathyroidism of renal origin
- Neutropenia, unspecified
- Heart disease coronary artery w/ other angina
- Unsp. atherosclerosis of arteries of extremities
- Lobar pneumonia, unspecified organism
Disease-Specific Findings
Diabetes
One of the larger changes for version 28 came under the “Diabetes Disease Group.” In version 24 there were three Hierarchical Condition Codes (HCCs) for diabetes: HCC 17 – Diabetes with Acute Complications, HCC 18 – Diabetes with Chronic Complications, and HCC 19 – Diabetes without Complication. Version 28 has four HCCs: HCC 35 – Pancreas Transplant Status, HCC 36 – Diabetes with Severe Acute Complications, HCC 37 – Diabetes with Chronic Complications, and HCC 38 – Diabetes with Glycemic, Unspecific, or No Complications.
Overall, we found that the total number of beneficiaries who had an HCC under the Diabetes Disease Group barely changed between versions 24 and 28. There were 7,720,192 diabetics under version 24 and 7,717,224 under version 28 – a decrease of 0.04%. However, there are a few other changes that affect diabetics within the model, which appear to shift diabetics who were in a “sicker” HCC under version 24 to a “less sick” HCC under version 28. Overall, the number of beneficiaries who were classified under either HCC 18 (v.24) or HCC 37 (v.28), both of which are Diabetes with Chronic Complications, dropped 13% between the models and the number of beneficiaries who would be classified as HCC 19 or HCC 38, which is essentially Diabetes with No Complications, rose almost 38%.
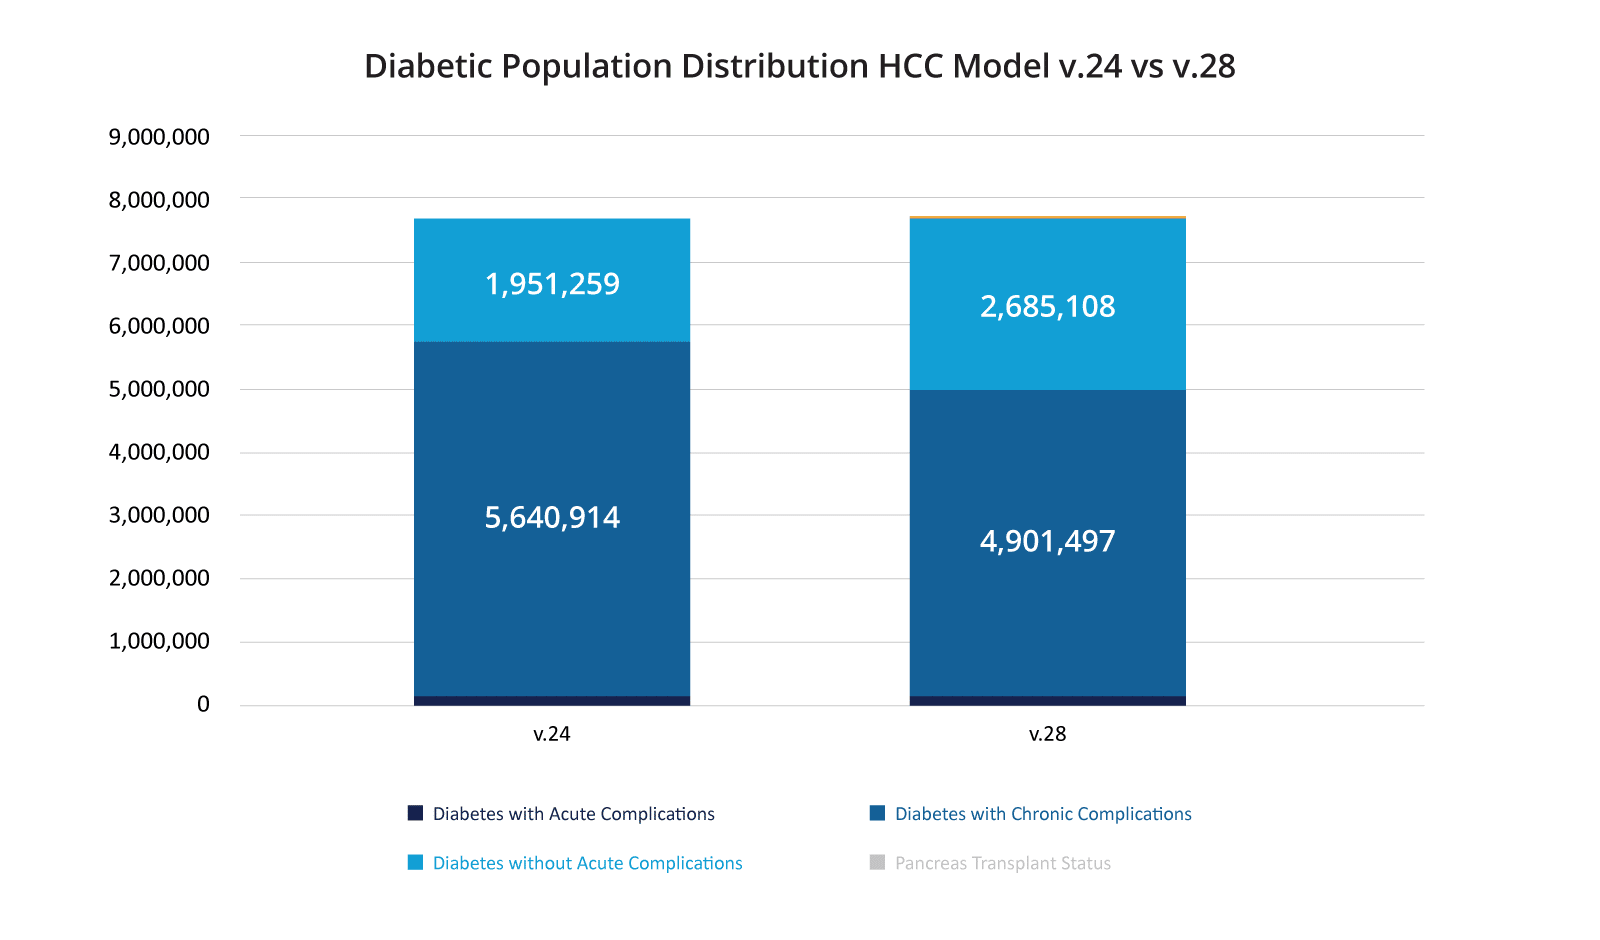
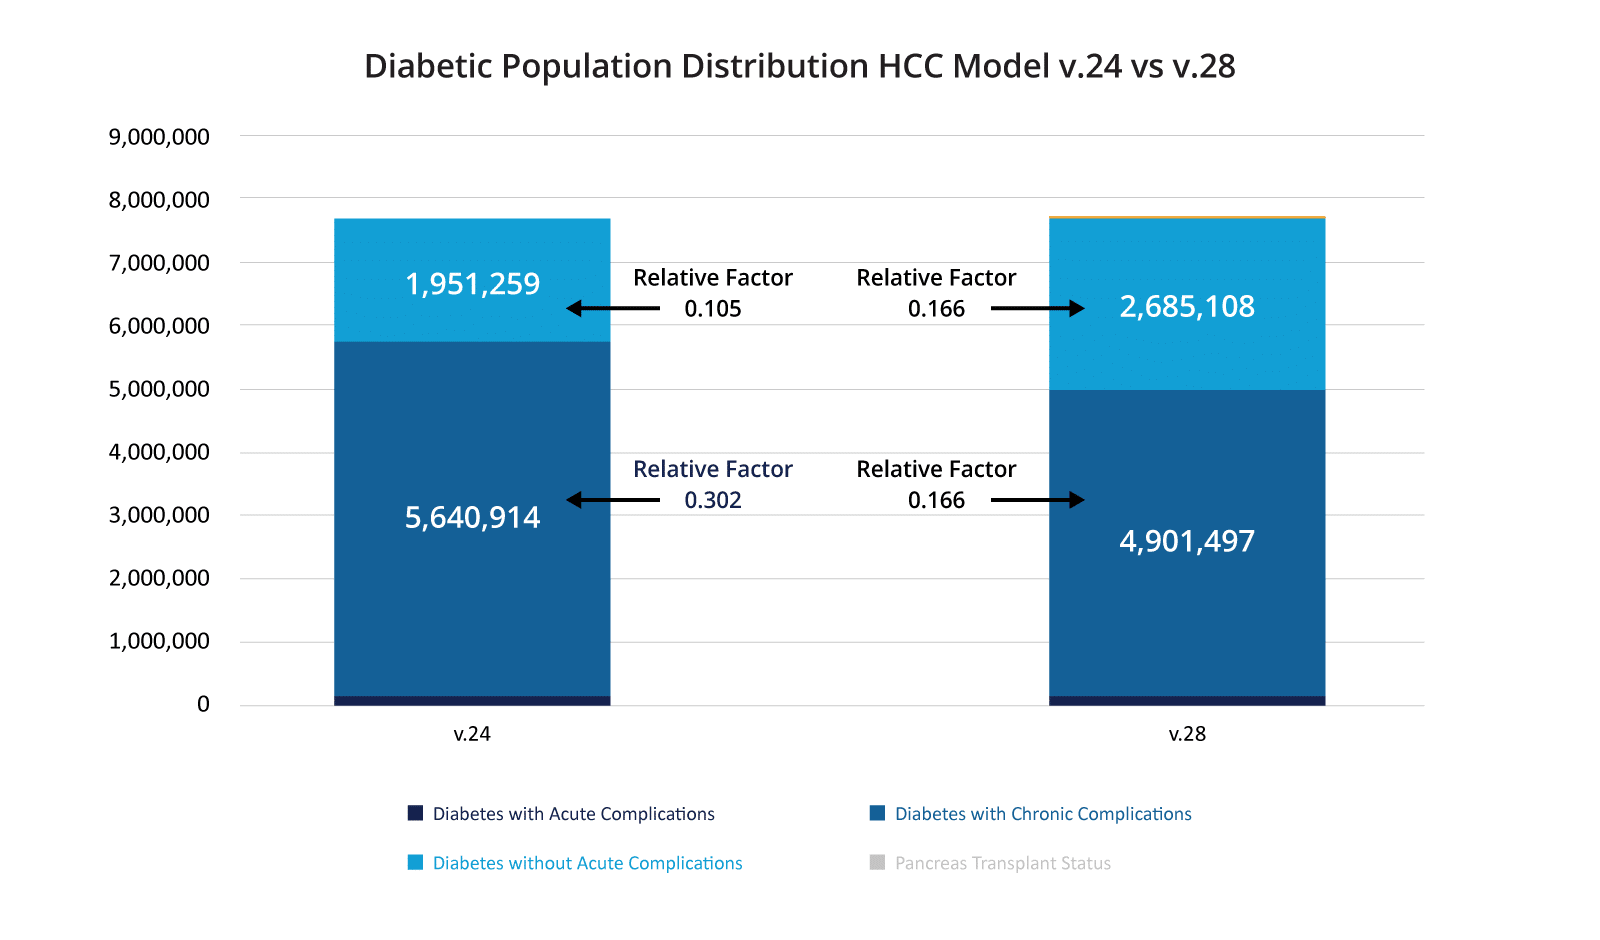
One final change happened in the Diabetes Disease Group. In the version 24 model, HCCs 17 and 18 (Acute and Chronic Complications) had “relative factors” of 0.302 for the non-dual, aged beneficiaries. As we explained in our prior blog post, these “relative factors” are indicators of how much a beneficiary’s health care is estimated to cost because of that condition, or stated another way the incremental cost of a beneficiary’s healthcare because of that condition. In version 24, HCC 19 – Diabetes without Complications had a relative factor of 0.105 – so the cost of care for diabetic with no complications was projected to be a third of what a diabetic with complications costs under version 24 of the risk scoring model with the other two diabetic UCCs under v.24 having a relative factor of 0.302.
In version 28, CMS has elected to hold the relative factors constant between HCCs 36, 37, and 38 (Diabetes without Complication, Diabetes with Chronic Complications, and Diabetes with Severe Acute Complications). So, each of HCC 36, 37, and 38 have a relative factor of 0.166 in version 28, indicating that no matter the severity – version 28 of the HCC model predicts that the increase in cost for a diabetic is the same.
Looking at the above diagram with these relative factors included, you can see that under v.24 of the model, a substantial group of diabetics had a relative factor nearly three times higher than the diabetics without complications. Under v.28 of the model, all diabetics will have the same relative factor, which is slightly higher than the v.24 relative factor for diabetics without complications. This will result in a significant decrease in spend on the diabetic population under version 28 of the risk adjustment model. Proponents of the model change argue that version 24 has historically overestimated the amount of money necessary for diabetic care. Opponents of the model argue they are using these funds to prevent disease progression and this decrease in funds will result in worse care for their diabetic population and increased spending long term. Unfortunately, claims data rarely identifies beneficiary enhancements that would be used to care for the diabetic population so it is nearly impossible to empirically validate this concern.
Claims data also constrain our ability to more accurately predict diagnoses that increase total expected cost of care, or more usefully, to better match population segments to clinical interventions that can help slow disease progression and lower future care costs. As an example, when CareJourney President, Aneesh Chopra, served as U.S. Chief Technology Officer, he helped launch the 2011 “Health Care Innovation Challenge” designed to surface promising interventions that meet CMMI statutory authority to scale payment models that lowered cost and improved quality, as certified by the actuary.
One such intervention, the Diabetes Prevention Program, met the actuary’s requirements, achieving a net reduction in expected costs based on an actuarial model built on diabetes disease progression, starting with pre-diabetics. Importantly, the CMS Actuary emphasized the importance of incorporating clinical data (currently available as “USCDI” in Cures Act certified EHRs) by limiting eligibility of the DPP benefit to “beneficiaries with an Impaired Fasting Glucose of 110 to 125 mg/dl…[placing] a greater focus on those who are far more likely to become diabetic.” OACT further stated that, “these changes could improve the savings achieved by the program.”
Several years into the general availability of the benefit, we continue to observe what we reported just prior to the pandemic about the failure of the DPP program to reach this important beneficiary segment. Further, the CMS Office of Minority Health noted in its November 2021 “Diabetes Data Snapshot” that in addition to widespread variation in disease prevalence by race, ethnicity and geography, only 4% of Medicare beneficiaries took advantage of a Part B diabetes screening benefit in 2020.
Congestive Heart Failure
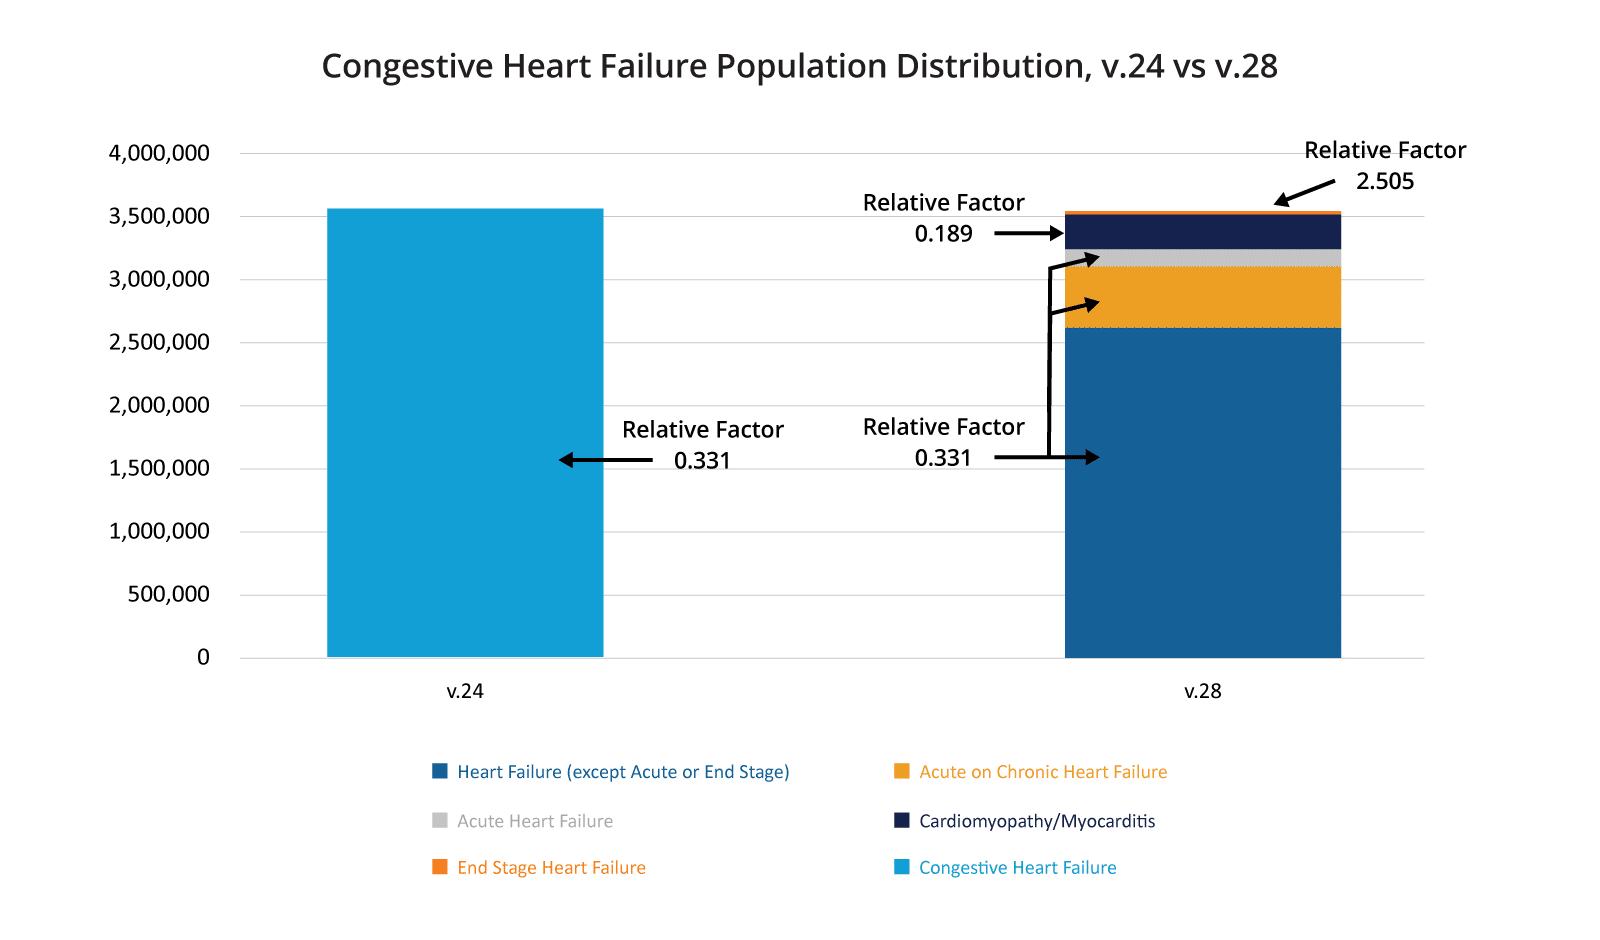
As with diabetes, CMS has constrained some of the HCCs classified under heart failure indicating that beneficiaries with any of these constrained HCCs are predicted to cost the same amount for care in the payment year. Unlike diabetes, this looks like it will result in an overall increase in spending on beneficiaries with some form of heart failure. As you can see in the chart below, in version 24 all beneficiaries with “Congestive Heart Failure” fell under one category, and that category had a relative factor of 0.331. In version 28, this same set of beneficiaries is divided into five categories, the vast majority of which fall under three of the HCCs with constrained relative factors, with that factor being 0.360. In addition, a very small portion of these beneficiaries fall into “End Stage Heart Failure” and have a relative factor of 2.505. Only a small percentage of the overall beneficiaries, those with “Cardiomyopathy/Myocarditis,” are projected to cost less under version 28. Overall, this means that a bulk of the beneficiaries with some form of heart failure will have higher risk scores under version 28 than version 24.
Depression
The impact of CMS’s proposed version 28 of the risk adjustment model undeniably affects minorities and duals more so than it does White beneficiaries and non-dual beneficiaries. Unfortunately, the rate of depression amongst minorities and duals is higher than their counterpart populations. In 2021, in the Medicare Fee For Service population, 32% of dual-eligible beneficiaries had a diagnosis of some kind of depression vs. 21% of the non-dual population. Amongst dual eligible beneficiaries enrolled in an MSSP ACO, that number jumps to 38% indicating that duals are likely under-diagnosed in the general Fee for Service population. For minorities the situation is even bleaker: in 2021, 43% of MSSP ACO enrolled African American beneficiaries and 43% of Hispanic beneficiaries were diagnosed with depression versus 27% of MSSP ACO enrolled non-Hispanic White beneficiaries.
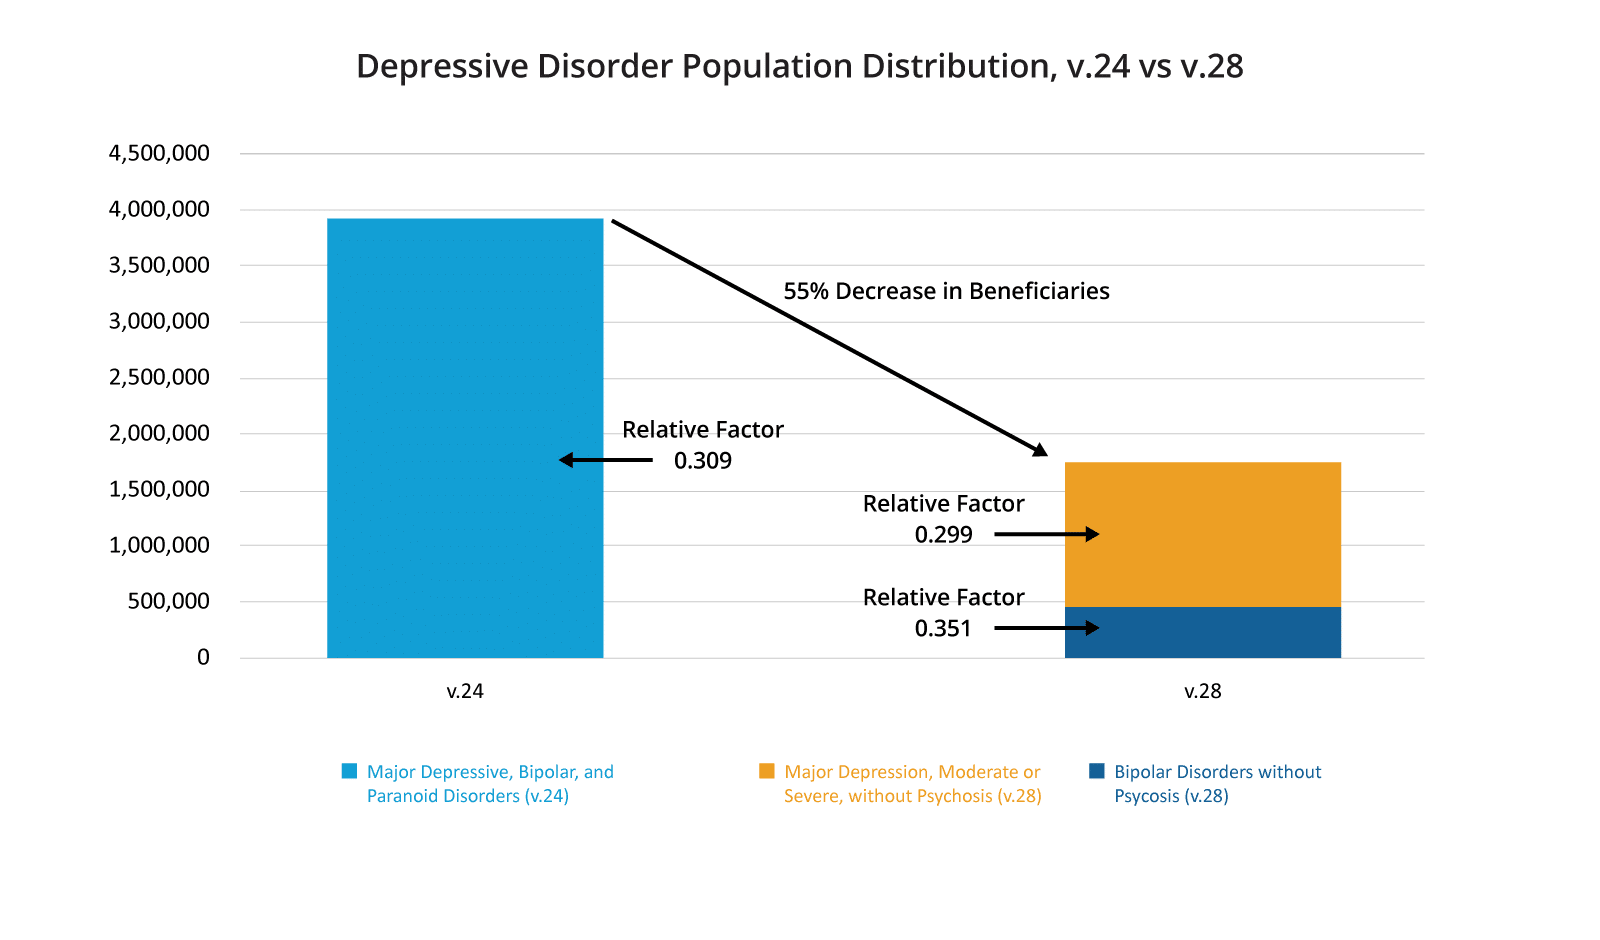
As we discussed above, the psychiatric disease group lost 50% of the diagnosis codes that previously related to an HCC in version 24, with a majority of those falling under the depression subcategory. Unlike the prior two disease specific data analyses for diabetes and congestive heart failure where the overall beneficiary count stayed relatively stable between the two models, the percentage of beneficiaries classified under the depression subcategory of the psychiatric disease group fell by 55%. As you can see in the below chart, for a majority of the beneficiaries who remain in this disease group, the relative factor has also decreased meaning this population is projected to cost less annually under version 28 than under version 24. Unsurprisingly this will result in a large drop in overall funds spent on the care of depression under version 28 of the risk scoring model.
Conclusions
There are valid reasons to modify the CMS HCC Risk Scoring algorithm to more appropriately predict healthcare costs for a beneficiary. Coding abuse and the absence of an increase of costs due to a diagnosis are two valid reasons. The search for a proper methodology to predict how much a beneficiary’s healthcare will cost in a payment year is a complex problem that will require many bright minds collaborating if we are to make steps towards solving it. Accounting for upcoding practices while also not penalizing practitioners who are justifiably and correctly utilizing diagnosis codes to provide better preventative care to beneficiaries is a fine balance. There are valid arguments for not utilizing risk scoring to address disparities in healthcare for dual eligibles and minorities. However, any policy changes should not exacerbate these already large disparities, which version 28 of the HCC model appears to do.
If the purpose of risk scoring is solely to predict how much a beneficiary will cost the healthcare system in a payment year, then we must proffer additional mechanisms to (1) incentivize preventative medicine that will attempt to flatten a beneficiary’s cost curve in future years; (2) create mechanisms outside of risk scoring methodologies to adjust for the disparities that duals and racial minorities already face; and (3) continue iterating on risk scoring algorithms that minimize coding abuse amongst organizations prone to upcoding behavior without penalizing organizations who are correctly coding beneficiaries.
Version 28 of the HCC model as proposed by CMS is an iteration of the methodology aimed at more accurately predicting patient costs in a payment year. It appears to disproportionately impact duals and minorities by decreasing their risk scores more so than for non-duals and White beneficiaries. It also seems to implicitly state that beneficiaries who are diabetic and beneficiaries with depression are not predicted to cost as much as version 24 of the HCC model has projected over the past few years. In modifying the risk scoring methodology, CMS has relied on Principle 10 of Risk Scoring Methodology,1 which states that discretionary diagnoses should be excluded from payment models. Principle 10 is the last of ten principles on this list. Principles 1 and 2 state that diagnosis categories should be clinically meaningful (1) and predict medical expenditures (2). We simply have not seen enough research showing that the discarded diagnoses under version 28 are “discretionary” such that Principle 10 tips the balance away from Principles 1 and 2, especially when version 28 appears to widen disparities for minorities and duals.
How Will You Be Impacted?
See the v24 to v28 normalized risk score impact for your population, evaluate what high-volume HCCs and diagnoses are driving your impact, and benchmark your impact against the market or competitors.
