This is our second blog in a series about ACO REACH. Read the first installment, How ACO Reach Compares to Direct Contracting.
As we discussed in our first blog post on ACO REACH, one of the concerns about Direct Contracting was patient risk coding abuse (also called “coding intensity”). Risk coding, or risk scoring, is used by Medicare Advantage (MA) to determine the payment an MA plan will receive for a given beneficiary. Risk scoring is also used by the Medicare Shared Savings Program (MSSP) to determine benchmarks, which in turn determine how much savings an MSSP Accountable Care Organization (ACO) receives each year. Global and Professional Direct Contracting (“Direct Contracting”) also uses risk scoring to determine the amount each Direct Contracting Entity (DCE) receives to manage a beneficiary’s care.
April 2023 Update: Read about the risk scoring changes finalized in the MA Rate Announcement.
Aligning incentives for medical care payments is a complex issue. Fee for service incentivizes more services to generate more fees, for example. Moving to value-based care arrangements also surfaces issues of incentive alignment. There is a long-standing concern surrounding risk scoring. Since risk scoring is one of the factors that determines how much money an MA plan, MSSP ACO, and DCE receives each year, higher risk scores can mean more money for providers. This strategy only works, however, if the risk scores are artificially higher and the patient’s care costs less than the risk score predicts. For MSSP ACOs, this additional money comes in the form of higher savings since higher risk scores yield higher benchmarks. For MA plans and DCEs, this comes in the form of higher capitation payments, some of which, in theory, go unused because costs are lower than predicted.
There are legitimate and important reasons why a beneficiary’s risk score might increase, especially as we look towards closing care gaps caused by health inequities. Many beneficiaries who are not part of an MSSP ACO, DCE, or MA plan do not participate in preventative care, including annual wellness visits. In fact, many beneficiaries in underserved areas do not receive any primary care services. Beneficiaries in these communities frequently cannot or do not utilize the healthcare system either because of lack of access, transportation, money, or other factors. When beneficiaries don’t utilize the healthcare system, their chronic conditions are not recorded and therefore not reflected in their risk score. As an example, a patient who has heart disease or kidney disease might not need or seek care for over a year, which would decrease their risk score despite the beneficiary continuing to have those diseases.
ACO REACH is incorporating incentives to treat these underserved beneficiaries by incorporating the Area Deprivation Index and whether or not a beneficiary is eligible for both Medicare and Medicaid into a potential $30 Per Member Per Month benchmark bump. Utilizing these vulnerability indicators to properly account for the true cost of caring for underserved beneficiaries has been the subject of academic research in the past decade. For example, Massachusetts has been working to incorporate a Neighborhood Stress Score (NSS), a composite index of seven census factors, into risk scoring for MassHealth’s Medicaid program. The NSS originated from research out of University of Massachusetts and was published in JAMA, finding that a risk scoring algorithm that does not take these social determinants of health into account routinely underpays for underserved populations.
Even for beneficiaries who are not located in underserved locations, traditional Medicare with its Fee For Service payment mechanism does not put an emphasis on accurate chronic condition coding. Reimbursement for Fee For Service Medicare is not based on the beneficiary’s risk score, and therefore treating professionals do not have the proper incentives to properly capture all of a beneficiary’s chronic conditions. CareJourney recently completed a joint research project with Rush University Medical Center in Chicago, examining the rate of recapture for chronic diseases across the Nationwide Medicare Fee For Service database. We ranked chronic diseases by their frequency and recapture rate in order to identify those prevalent conditions that most often go unrecaptured.
All of these factors can lead to a beneficiary being under coded because they may have disease conditions but not know it or seek care for it within a given year, or their known chronic conditions are not properly recaptured year over year. As these beneficiaries transition to value based care arrangements and have more regular preventative care, with physicians who are incentivized to properly capture their patients’ chronic conditions, it is expected that their risk scores will grow, sometimes substantially.
It has long been a struggle to balance a systematic way to determine a beneficiary’s benchmark or capitation payment against this financial (mis)incentive to have patients that look sicker. Most programs that CMS or the CMS Innovation Center have launched have tried to combat patient risk scoring abuse in some form. MA has risk scoring audits and medical loss ratios (which require 85 cents of every dollar go directly to patient care). Direct Contracting has a 3% growth cap on risk scores year over year and also applies a retrospective coding intensity factor. ACO REACH is continuing the 3% growth cap on risk scores, but instead of allowing these scores to grow 3% year over year, the 3% risk score growth cap will be from a static base year (that base year has not been announced), with an allowance for REACH ACOs to exceed this growth cap if the demographic relative factors of their beneficiary base change. This cap has caused some consternation and confusion amongst provider organizations, so we will dig deeper into risk scoring in the ACO REACH program to figure out the impacts of this new risk-scoring algorithm.
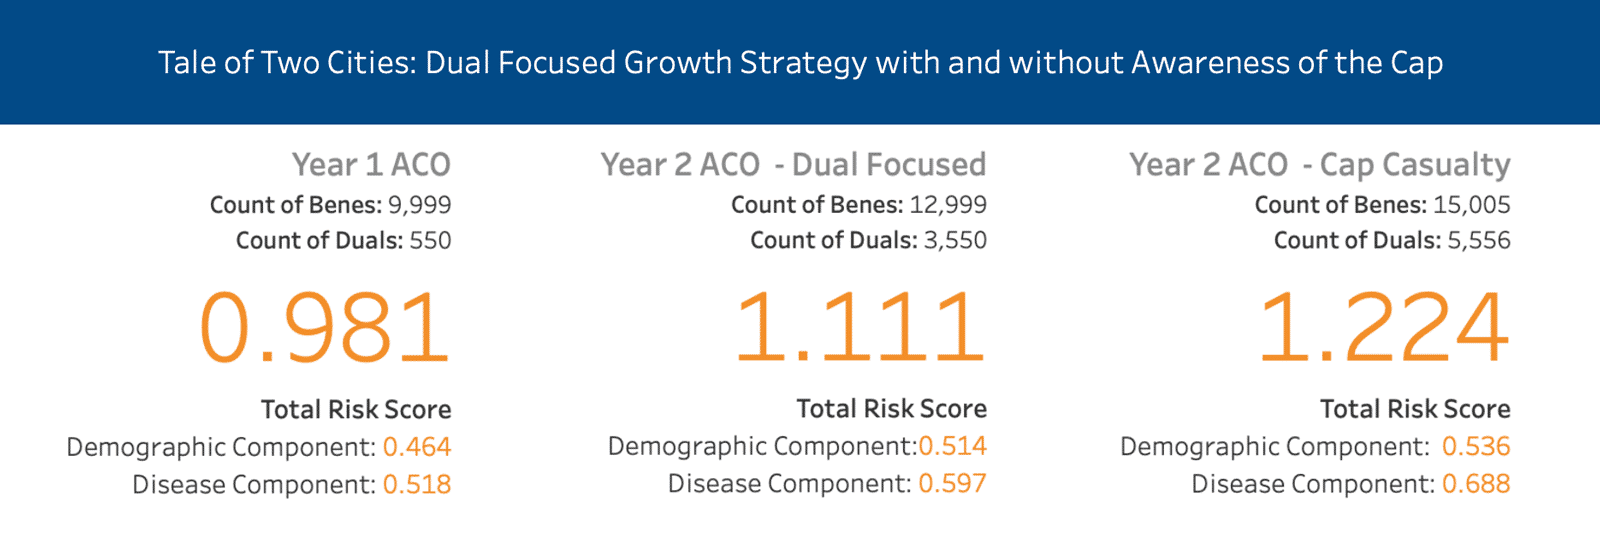
Later in the blog, we examine a hypothetical case study comparing an ACO’s growth strategy, outlined in the image above. In Scenario 1, the ACO focused on growing Duals but exercised meaningful, careful growth in year 2 whereas in Scenario 2, the ACO took in as many Duals as possible resulting in a cap casualty in year 2 (outlined above). Go to our data dashboard for a better understanding.
What is a Risk Score?
A risk score measures how much a beneficiary’s healthcare is expected to cost relative to an average beneficiary. An average beneficiary will have a risk score of 1.00. If a beneficiary has a risk score of 1.20, that means that their healthcare for a given year is expected to cost 1.2 times that of an average beneficiary. In Q2 2021, the average HCC score across all Medicare Fee For Service beneficiaries, including those that are eligible for both Medicare and Medicaid, was 1.000.
There are multiple algorithms used to generate risk scores, but MA and Direct Contracting (Standard and New Entrants) have used the same algorithm for the past two years: the 2020 CMS-HCC risk adjustment model, or Version 24 (v24). The RFI for the ACO REACH program says that the particular risk score model for PY2023 will be described in the Participation Agreement. For the purposes of this blog post, we will assume that it will be the same model currently used. The CMS-HCC model is a prospective model, meaning it looks at claims history and predicts what a beneficiary will cost in a given year. High Needs Direct Contracting Entities use a different model that has been developed by the CMS Innovation Center that is a concurrent risk adjustment model to account for the increased variation in costs for the high needs population. We will primarily focus on the CMS-HCC Model in this blog. For the curious, CMS has published an in-depth publication on risk scoring for Direct Contracting and the Kidney Care Choices models.

Risk scores are based on factors that fall into two buckets: demographic relative factors and disease relative factors. A beneficiary’s risk score is equal to the sum of his or her demographic relative factors risk score plus their disease relative factors risk score.
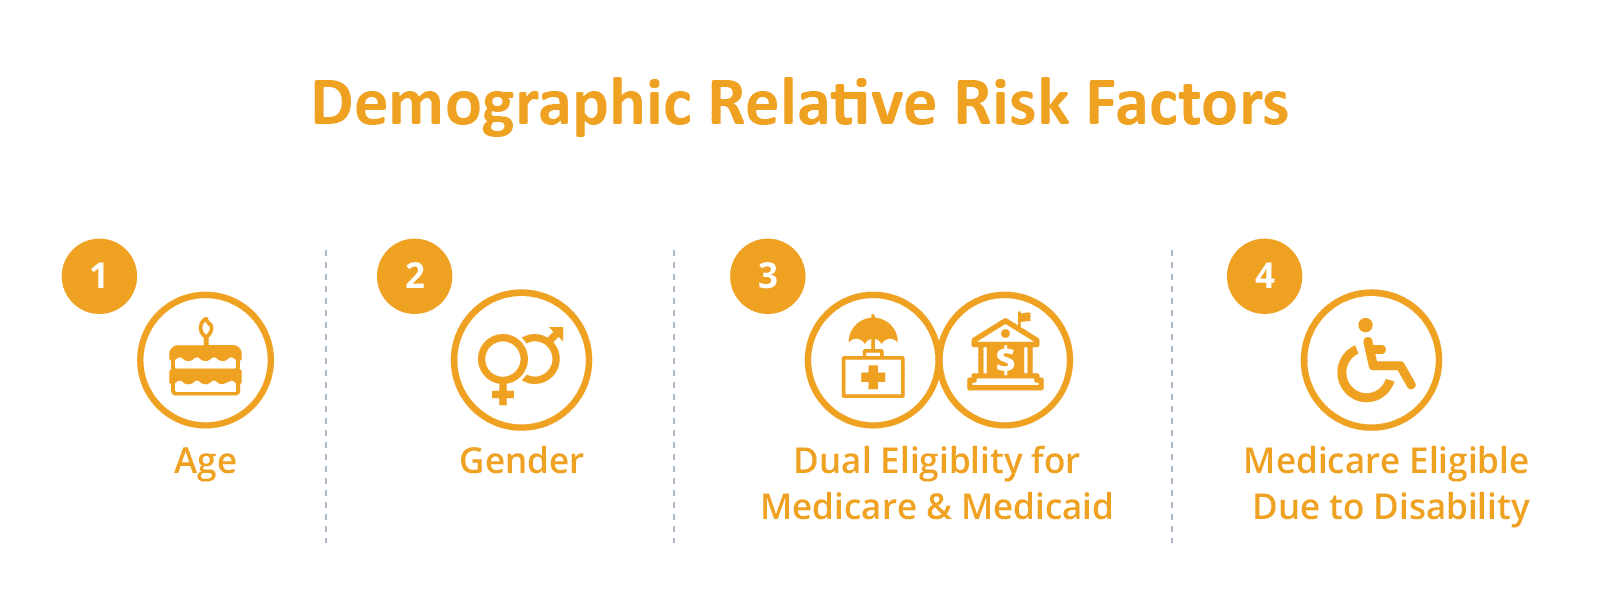
Calculating a beneficiary’s demographic relative risk factors is straightforward. The demographic relative risk factors score has four variables: gender, age, whether the beneficiary is eligible for both Medicare and Medicaid (called dual eligible), and whether the beneficiary became eligible for Medicare because they were “originally disabled.”
CMS provides a simple chart to calculate the risk score based upon these factors, which we’ve replicated a portion of below (find the full chart here). Footnote 1 (not pictured) tells us that the denominator is $9,365.50. This means that a beneficiary with a risk score of 1.000 is expected to have health care costs totaling $9,365.50. Based on the table, you can see that the demographic relative factors for a 72-year-old male who is dual eligible is 0.600.
| Variable | Community, NonDual, Aged | Community, NonDual, Disabled | Community, FBDual, Aged | Community, FBDual, Disabled | Community, PBDual, Aged | Community, PBDual, Disabled | Institutional |
|---|---|---|---|---|---|---|---|
| Male | |||||||
| 60-64 Years | – | 0.330 | – | 0.526 | – | 0.373 | 1.061 |
| 65-69 Years | 0.308 | – | 0.494 | – | 0.370 | – | 1.288 |
| 70-74 Years | 0.394 | – | 0.600 | – | 0.427 | – | 1.329 |
| 75-79 Years | 0.473 | – | 0.710 | – | 0.500 | – | 1.317 |
| 80-84 Years | 0.556 | – | 0.803 | – | 0.544 | – | 1.207 |
| 85-89 Years | 0.686 | – | 1.000 | – | 0.659 | – | 1.122 |
Calculating the disease relative factors is substantially more complex. All of the claims for a beneficiary are examined for diagnosis codes. Those codes are grouped into clinically related “Condition Categories.” Some Condition Categories also have hierarchies indicating a more severe presentation of the condition, for example chronic kidney disease (CKD) 3, 4, and 5 would exist in a hierarchy with CKD level 5 being the most severe. Each Condition Category is assigned a score (much like in the above chart) and a beneficiary’s disease relative factors risk score is the sum of all of the Condition Category scores. In the above example if a beneficiary had claims indicating both CKD3 and CKD5, they would only receive a score for CKD5. These individual codes are in the same table as the demographic relative factors.
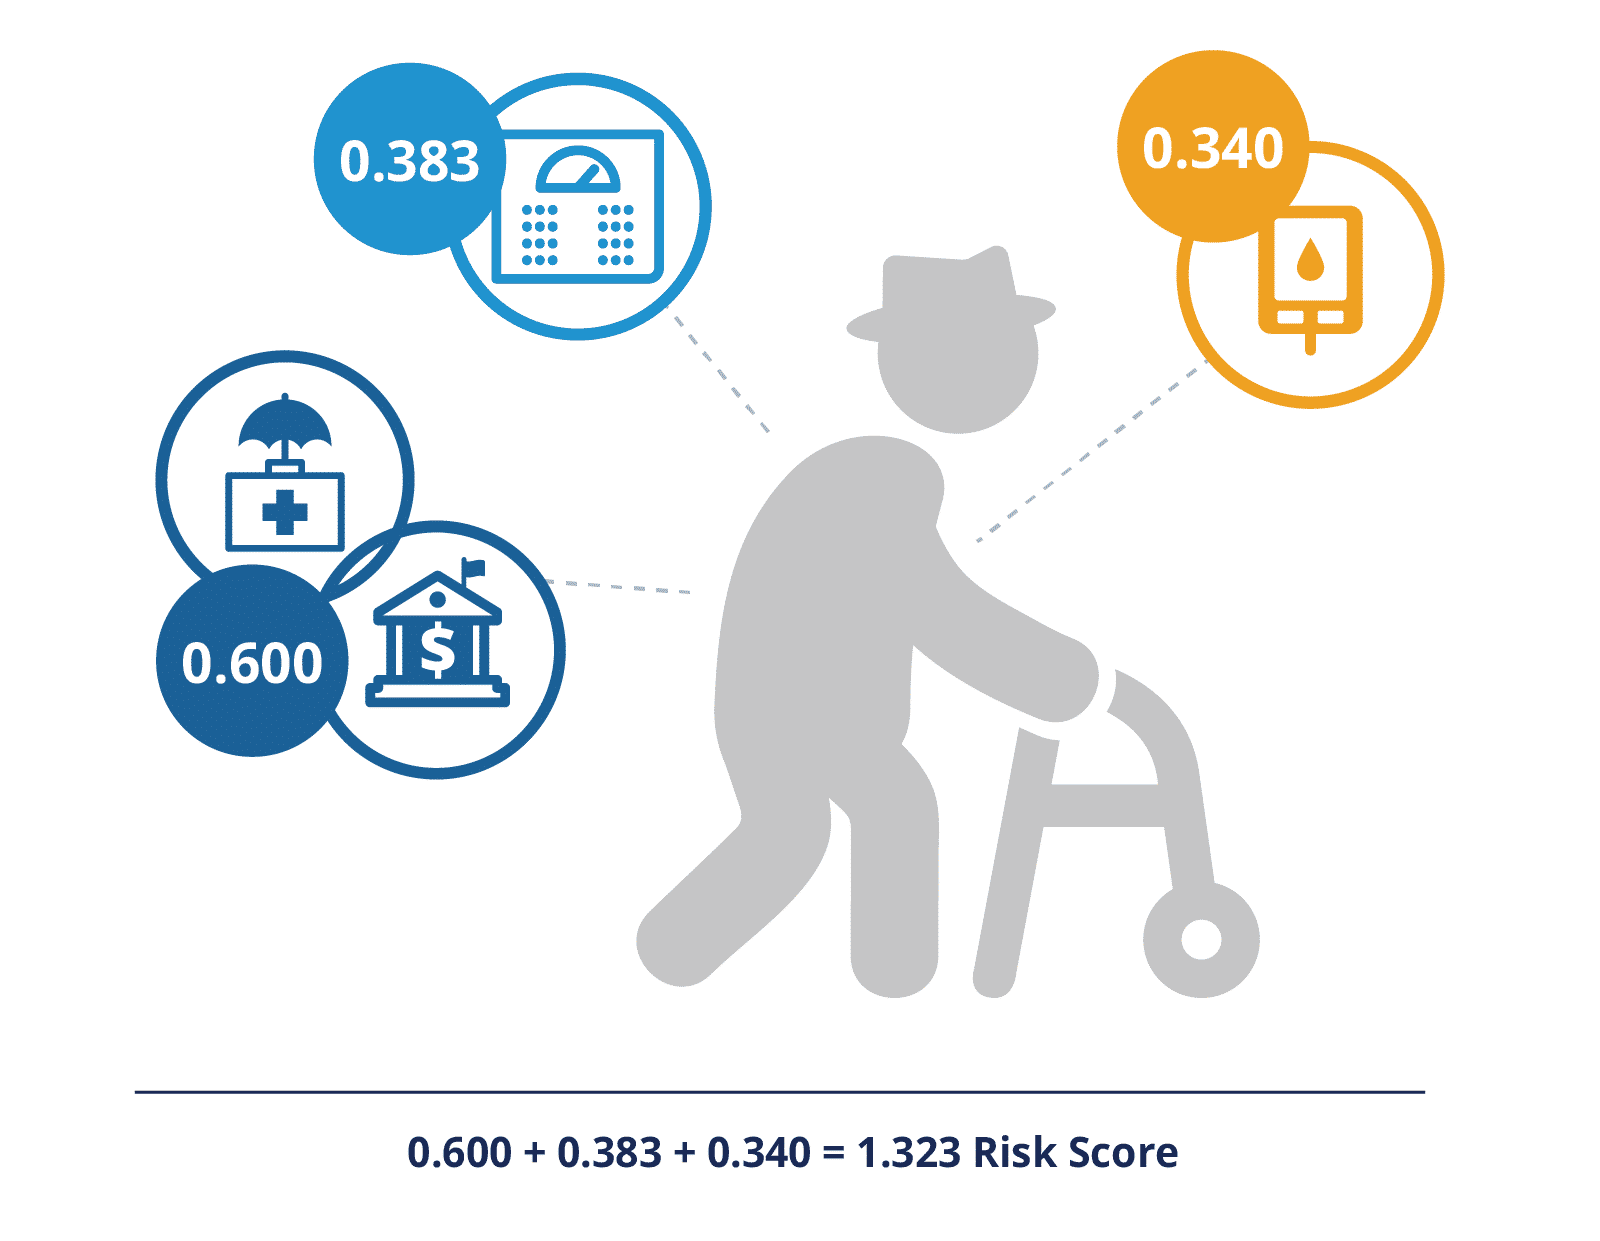
As an example, if the above 72-year-old, dual eligible male (0.600) also had morbid obesity (0.383) and diabetes with chronic complications (0.340), his HCC risk score would be 0.600 + 0.383 + 0.340 for a risk score of 1.323. There are additional scores for disease interactions, such as diabetes plus congestive heart failure and others.
Risk Scoring Case Study in ACO REACH
One of the new components of ACO REACH is a focus on health equity, including an upward benchmark adjustment of $30 per beneficiary per month for ACOs serving the most disadvantaged beneficiaries. However, ACO REACH is also using a risk score cap of 3% relative to a static base year to combat coding intensity. These two principles would be in conflict without allowing for increased risk score growth in the demographic relative factors. REACH ACOs would be unlikely to seek out beneficiaries that have a higher risk score if their capitation payments were capped, costing the ACO more than the ACO receives for their care.
In 2020, the average risk score for a non-dual eligible Medicare fee for service beneficiary was 0.949 whereas the average risk score for a dual beneficiary was 1.495, a 58% difference. Therefore, if an ACO has an average risk score close to 1, indicating a patient base representative of the national fee for service population, but adds a disproportionate number of dual-eligible beneficiaries, their risk score can easily grow more than 3% relative to the static base year. To mitigate this disincentive to add dual-eligible beneficiaries, the ACO REACH model provides that the 3% cap is relative to the increase in the demographic relative factors. In the ACO REACH RFP, the Innovation Center uses the example that if the demographic score for the beneficiary population increases by 1%, then the overall risk score can grow by 4%.
See a breakdown of two risk score growth scenarios
This dashboard uses an example REACH ACO and shows two scenarios around growth: one in which they’ve grown and remained under the 3% cap and another where they outgrew their cap.
Methodology
To illustrate this, we built a sample ACO using the Medicare Synthetic Public Use Files that are freely downloadable from CMS. We first removed all beneficiaries who were under age 65 (indicating individuals who were disabled or had ESRD) so that we were only dealing with an aged population for simplicity. We subtracted fourteen years from the ages of all of the patients (this data is from 2008) in order to get a population that is not overly weighted towards older beneficiaries and in line with the original data. We then utilized the table referenced above to calculate the demographic relative factors for each beneficiary. We made a proxy for risk scores by assigning weights to the chronic condition flags in the beneficiary summary file and summed up those scores for each beneficiary. Finally, we multiplied the scores for the non-dual eligible beneficiaries by an adjustment factor to ensure that their risk scores averaged out to 0.949 (the national average risk score for a non-dual eligible beneficiary) and similarly adjusted the scores for the dual-eligible beneficiaries to ensure their average was 1.495. Note: we could have used the claims files provided with the Medicare Synthetic Public Use Files to mimic the CMS HCC v.24 algorithm, but for the purposes of this example risk score precision at a beneficiary level was not critical.
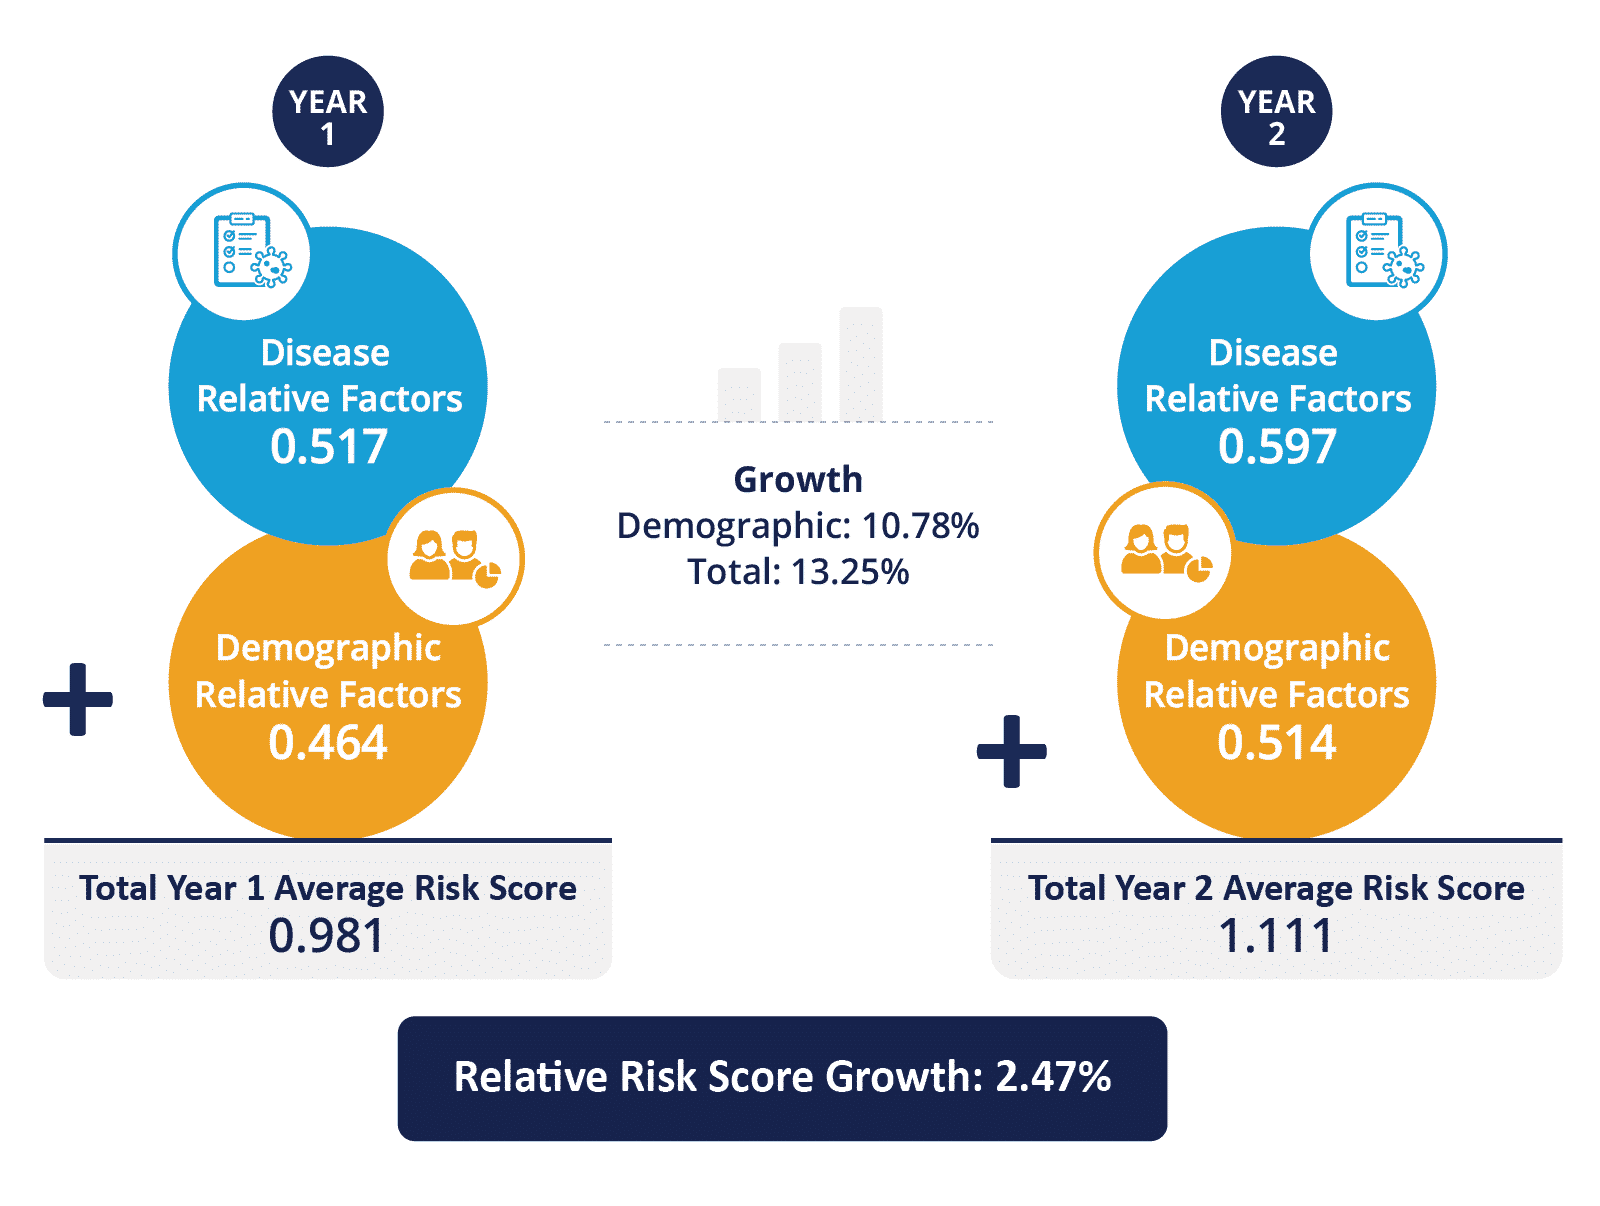
For year one of our sample ACO, we randomly selected 10,000 beneficiaries (out of the over 93,000 in the sample set), including 550 dual eligible beneficiaries. A dual-eligible population of 5.5% is well below the national average of 19%. The average risk score for this ACO is 0.981, which includes an average demographic relative factor score of 0.464 and an average disease relative factor score of 0.517.
Scenario 1: Dual-Focused Growth
Our sample ACO has decided that their growth strategy is to add only dual-eligible beneficiaries to their ACO in year 2. In year 2, our sample ACO added 3,000 additional beneficiaries, all of whom are dually eligible. These 3,000 new beneficiaries have an average risk score of 1.495, which includes an average demographic relative factor of 0.635.
Our sample ACO was extremely fortunate to not lose one single beneficiary between Year 1 and Year 2 – not to death, moving out of the area, or choosing a different provider. And, in some sort of miracle, all of our initial beneficiaries retained the exact same health profile with the exact same disease relevant factors component of their risk score. All 10,000 initial beneficiaries remain with our sample ACO, but of course they are now one year older which has increased their average demographic relative factor score to 0.478 (from 0.464).
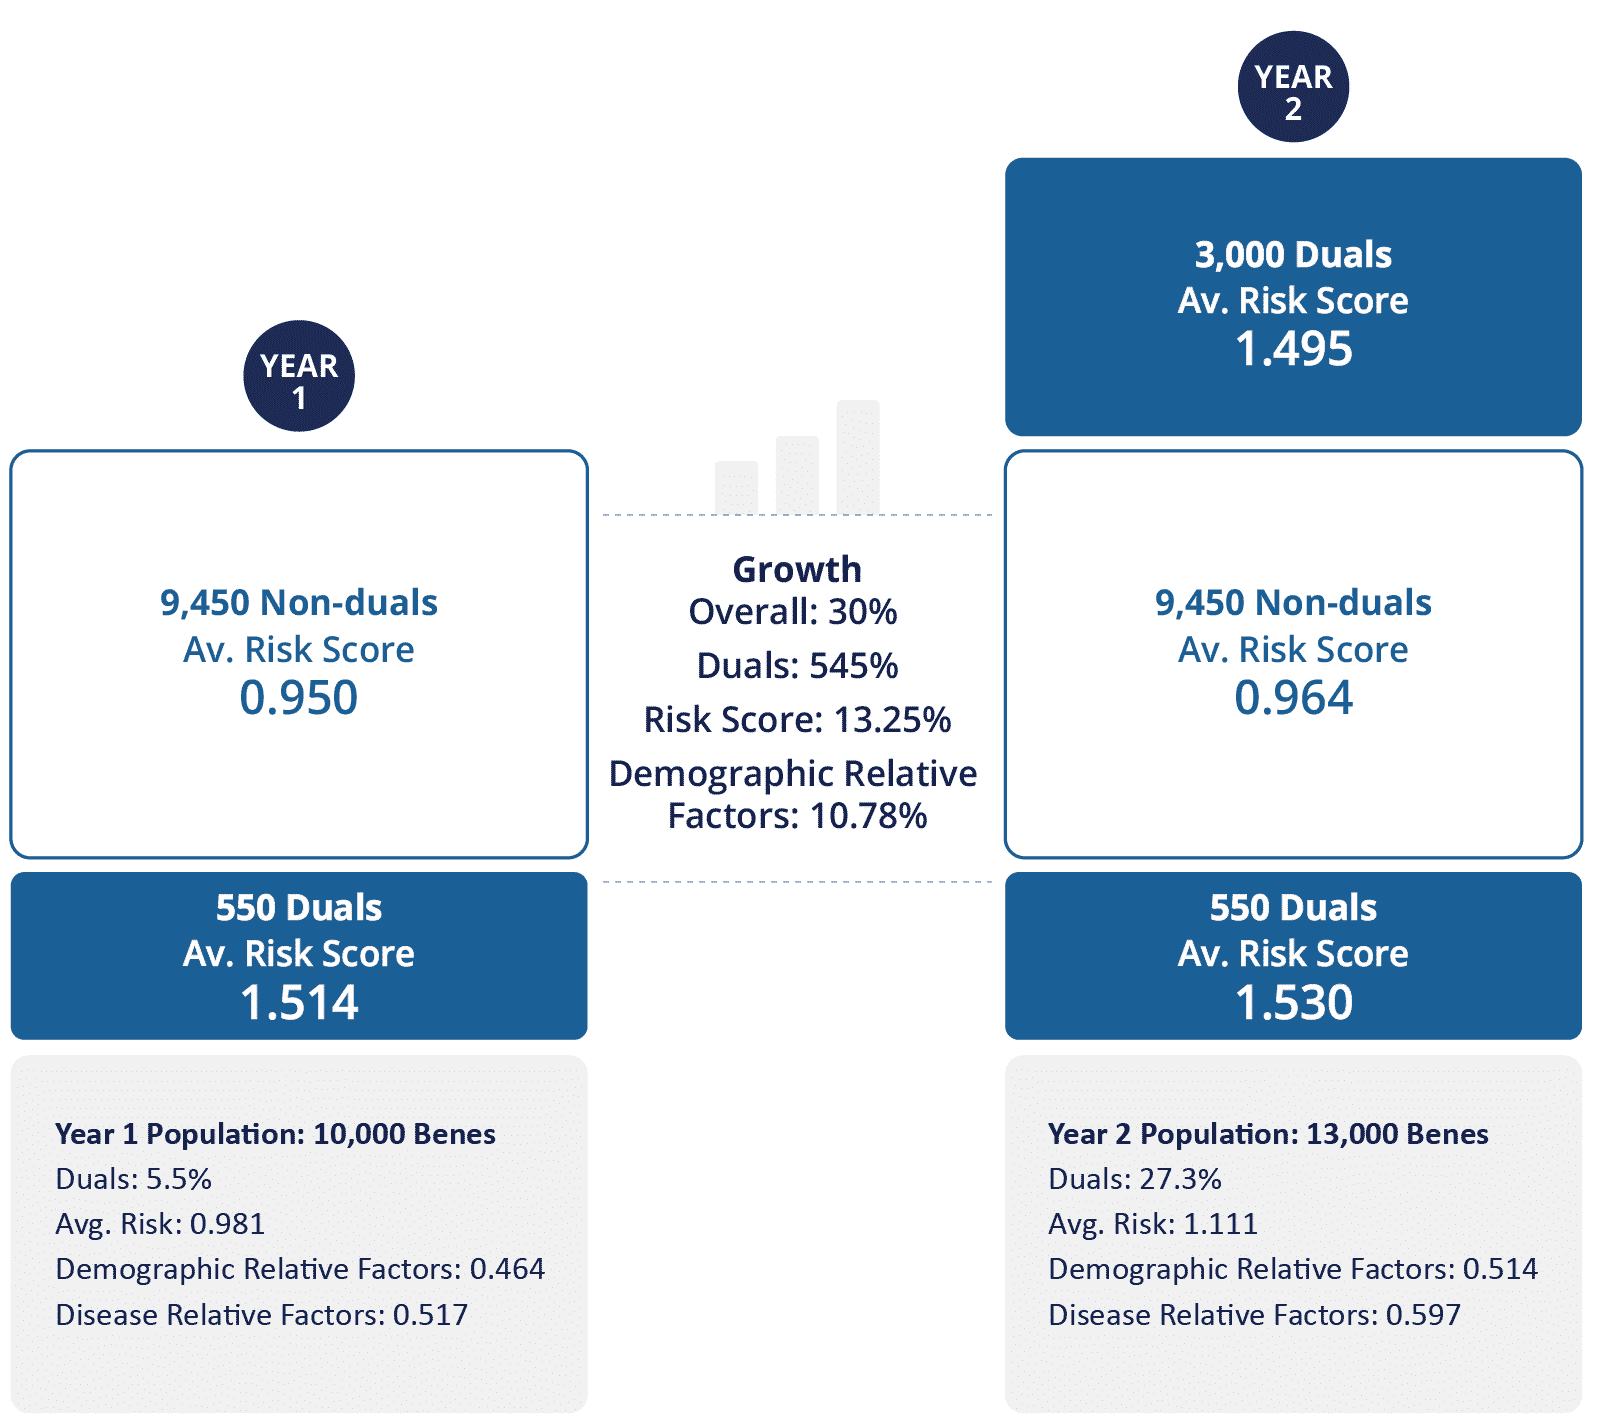
After Year 2, the ACO now has 13,000 beneficiaries with an average risk score of 1.111, an increase of 13% over year 1’s average risk score of 0.981 – well over the 3% cap. The breakdown of year 2’s 1.111 risk score includes a demographic relative factor of 0.514 and a disease relative factor of 0.596.
Since ACO REACH caps the risk score growth relative to the demographic score growth, we need to look at the percent risk score growth in that light. The demographic score from year 1 to year 2 grew from 0.464 to 0.514, which represents a 10.8% increase. The 3% cap is applied on top of the 10.8%, meaning the overall HCC score for our sample ACO can increase 13.8% before hitting this cap, and so our sample ACO is within these bounds for year 2 having only increased its overall average risk score 13.25%, for a relative growth rate of 2.47%.
Of course, the assumptions that we made to illustrate this point are not realistic: patients will die, patients will get additional chronic conditions as they age, no ACO will be able to add only dual eligible beneficiaries. But taking this somewhat extreme example serves as a good illustration of the risk score growth cap relative to demographic factors.
Scenario 2: Cap Casualty
In our second ACO example, we will use the same base ACO. However, in year 2, rather than adding 3,000 beneficiaries, they have added 5,006 dual-eligible beneficiaries (2,006 more than our first scenario, and a group that represents the sickest). These 5,006 beneficiaries have an average risk score of 1.679, which includes an average demographic relative factor of 0.652.
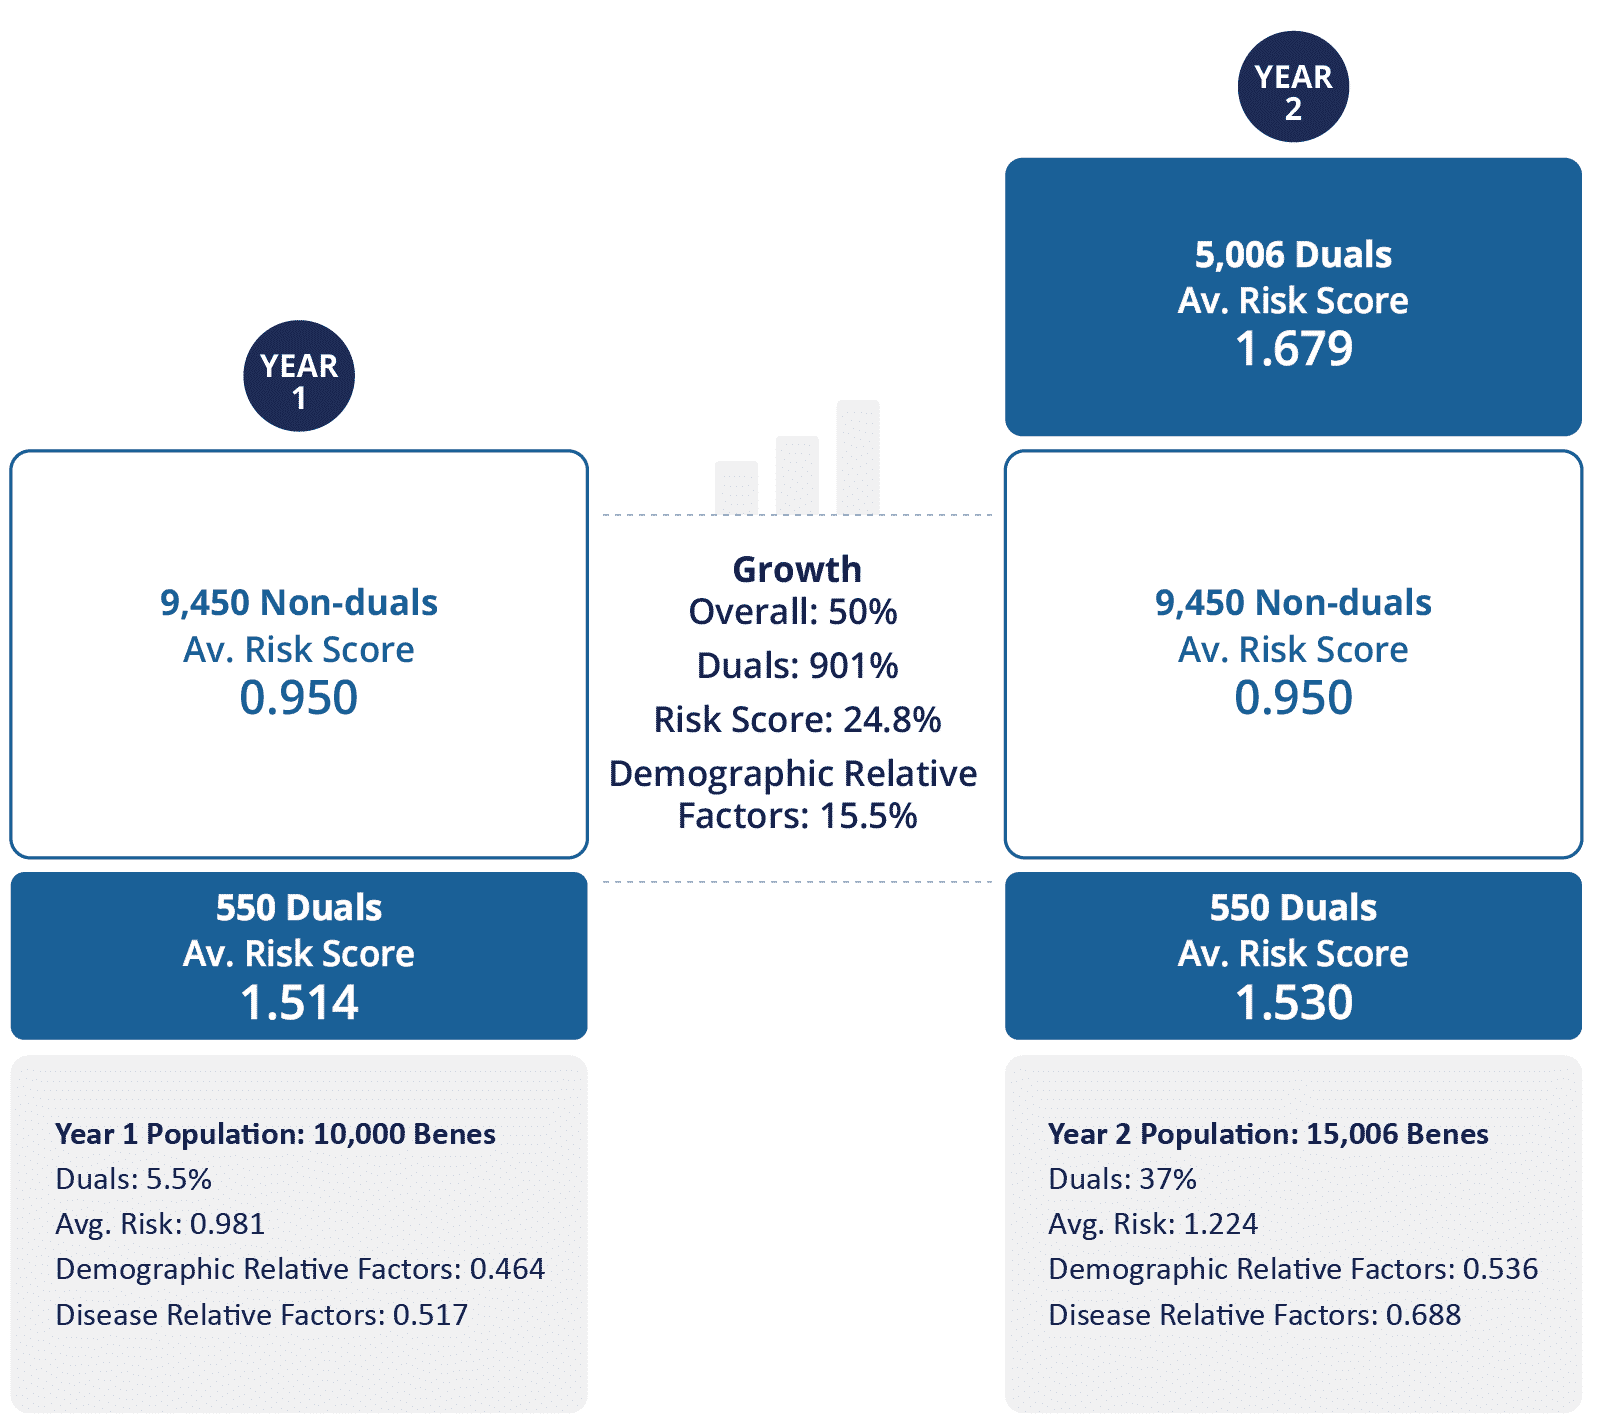
Looking at the percent risk score growth of the demographic score, we see an increase from 0.464 to 0.536, representing a 15.5% increase. The 3% cap is applied on top of this 15.5%, bringing us up to 18.5% which, in our example results in a cap casualty. The overall average risk score increased from 0.981 to 1.224, which represents an increase of 24.77% or a growth rate of 9.25% relative to the demographic score growth. Since the ACO is only allowed to grow at a 3% rate relative to the demographic factors, the risk score will cap out at 1.162 (before any coding intensity factor is applied). This is the risk score that will be used to calculate your benchmark and could put you at a significant disadvantage if your beneficiaries are sicker than that average risk score represents.
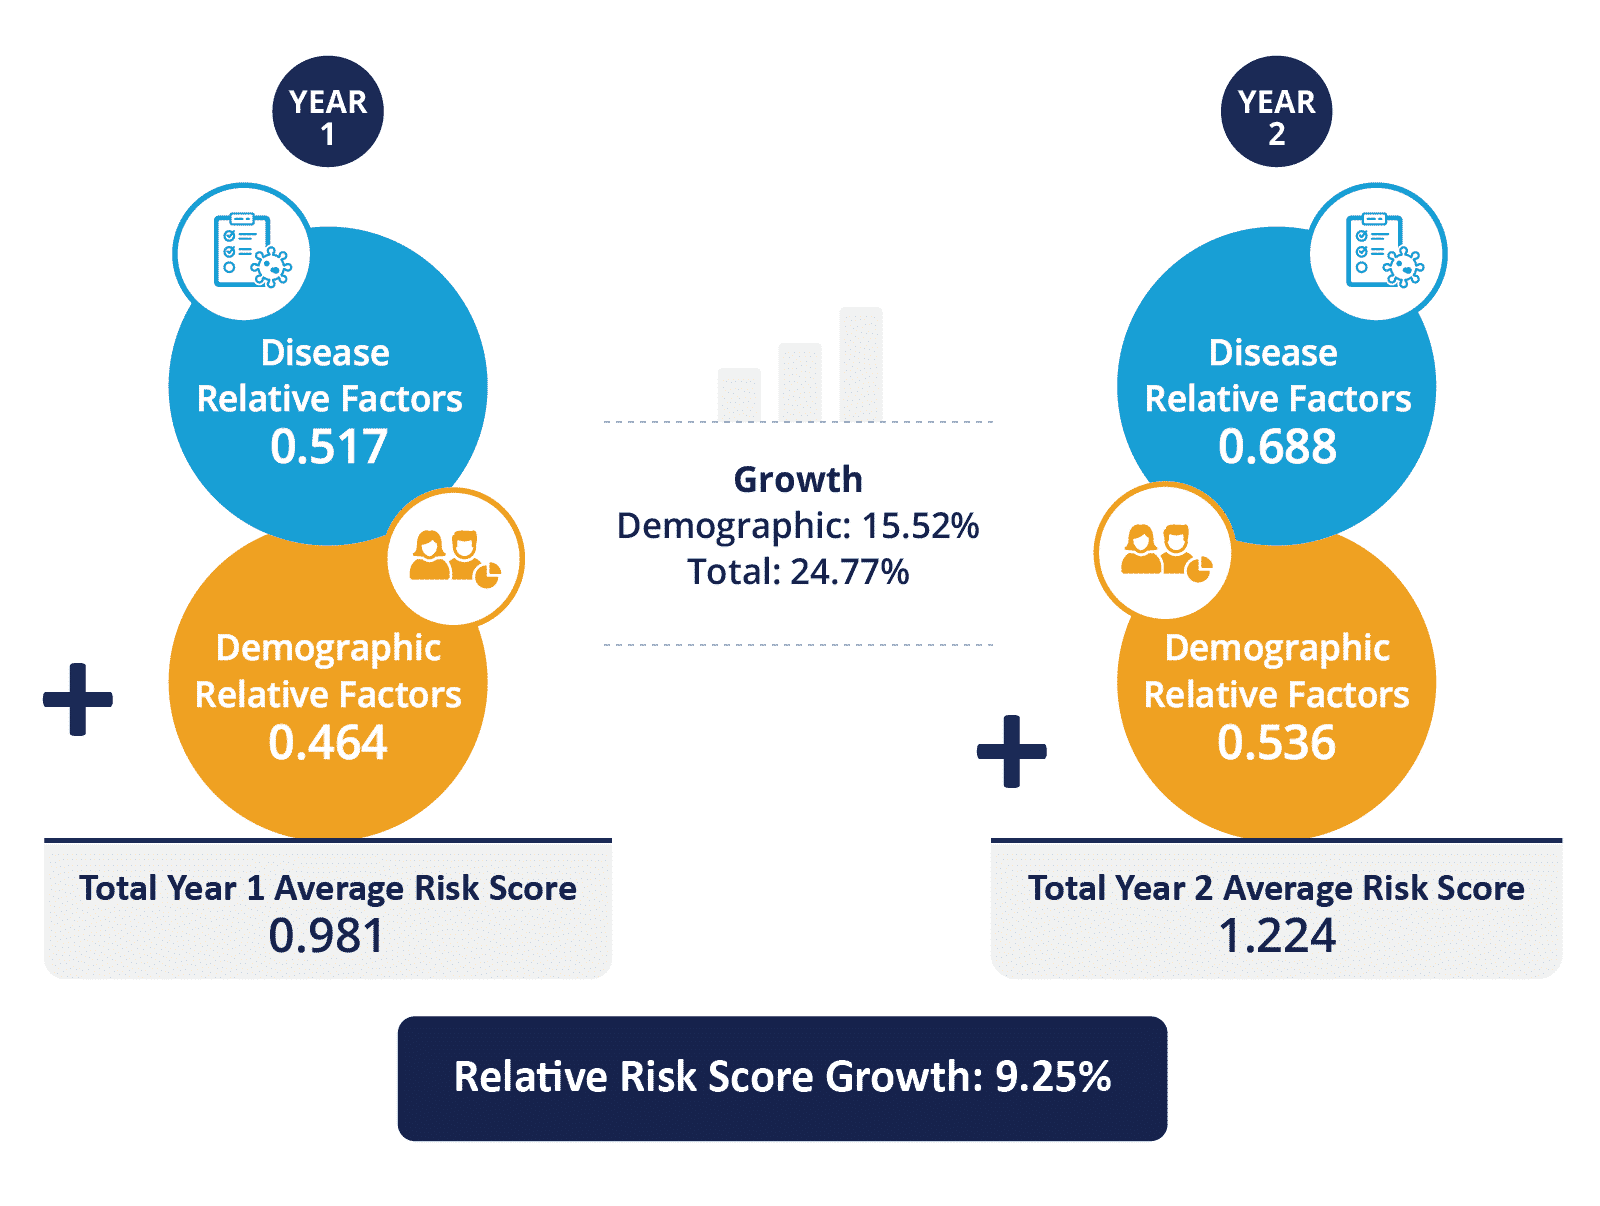
What the risk score cap in ACO REACH aims to control is disease relative factor score creep over the years. While it is expected that a beneficiary base that doesn’t change over time will have a risk score that grows as beneficiaries age (and therefore their demographic relative factor score increases) and they get sicker (increasing their disease relative factor score), the overall increase for an ACO is expected to be counterbalanced with younger beneficiaries joining the ACO.
We have heard concerns regarding this 3% cap on risk score growth relative to a static year. While this cap will certainly be a factor that REACH ACOs need to be cognizant of, the impacts on an ACO will be less than feared due to the allowance for unhindered demographic risk factor score growth. Although we shared an example of a cap casualty ACO above, to see the population grow in that way is not likely and would only occur if that ACO seeks out those beneficiaries and is not cognizant of the cap. With that in mind, we encourage each REACH ACO to ensure they understand the specific mechanisms of the model, including risk scoring.
Explore with CareJourney
CareJourney is a trusted partner to dozens of ACOs and DCEs, supporting new entrants to the ACO Reach Program as well as current DCE participants looking to transition to the new program. Our current members represent over half of the participating and preferred providers in Direct Contracting, making us the leading insights provider for these new and evolving risk models.
Data remains a critical component for REACH ACOs to succeed in the program. On a financial level, benchmarking, beneficiary alignment, risk score, and quality measure metrics will allow ACOs to gauge their performance within a given model year and make any modifications to their business model or practices for better success in future years. Additionally, REACH ACOs will need to develop a data strategy to examine the demographics, social determinants of health, and health inequities within their beneficiary base and the potential beneficiaries in their service area. REACH ACOs will need to track various measures in order to report successes and outcomes back to CMS as part of their required health equity plan.
CareJourney is your partner in all of these data strategies. Stay tuned as we continue this series spotlighting different areas within the ACO REACH program where our data can help your REACH ACO not just achieve financial savings, but provide better quality healthcare to all of the beneficiaries in your service area.
For existing DCEs (and future REACH ACOs), below are some additional ways CareJourney can help:
- Model attribution to help you understand alignment volumes
- Profile your regions and providers to understand the best partners
- Simulate your benchmarks to project your performance before finalizing your rosters
- Surface opportunities for Performance Improvement using your CMS supplied claims data
Reach out to your Member Services representative or by emailing jumpstart@carejourney.com to learn how we can help you today.
