
Identifying Your High Need Patient Population and High Performing Providers to Manage Their Care
With the move to value-based care, it is essential for healthcare organizations to be able to identify high need populations in their service areas and ensure that there are high performing primary care providers (PCPs) and specialists in those service areas to manage the care of these vulnerable patients. Imagine a county with a high prevalence rate of congestive heart failure (CHF). Are there enough cardiologists in the county that can treat these patients, and how do these cardiologists perform relative to their peers in the region?
For network and performance managers, it is important to identify service areas that could be facing care gaps, whether that be an inadequate number of providers, or these providers are not able to furnish the quality of care needed for these patients. Using open data sources and claims data, these organizations will be able to see a subset of patients and providers in this region, but may not be able to (1) capture non-attributed or assignable patients in the region that may be attributed in the future and (2) compare provider performance with their peers outside of their service area.
For network builders who are expanding to new regions or counties, it is important to understand the patient population, including chronic condition prevalence and high-need, high-cost prevalence. Especially when entering new markets, organizations may not have any current data on the patient population or the providers in the region.
The goal of these dashboards is to provide a preview of how CareJourney is able to use the 100% Medicare FFS data set to answer those gaps for both the network managers and network builders by highlighting the prevalence of the Frail/Elderly cohort of patients at the county level.
Defining the High Need, High Cost Patient Segmentation Model
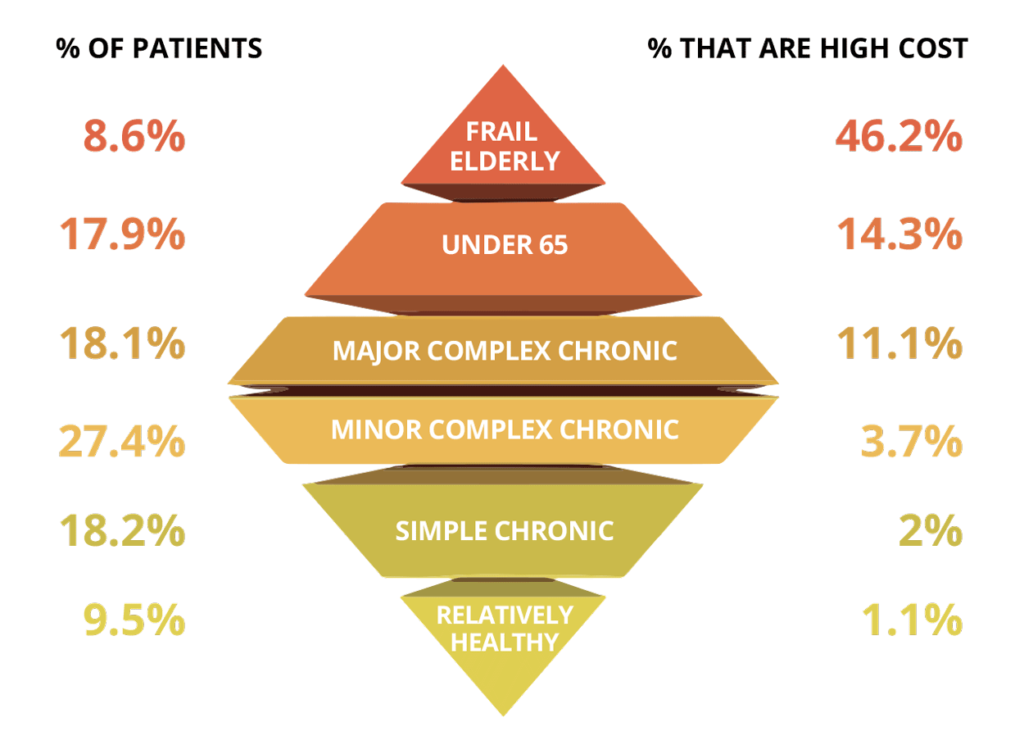
For the purpose of this analysis, we leveraged a Medicare high need, high cost patient segmentation model created by Ashish Jha and team at the Harvard School of Public Health. This segmentation model details six patient segments based on Medicare claims:
-
- Frail/Elderly
- Major Complex Chronic
- Minor Complex Chronic
- Simple Complex Chronic
- Under 65/Disabled/ESRD
- Relatively Healthy
The dashboard below focuses on these cohorts, including the Frail/Elderly cohort, which is defined by patients older than 65 who have the presence of two or more out of 12 claims-based diagnoses that could indicate frailty (ex. gait abnormality, malnutrition, etc.).1 This study also found that while the Frail/Elderly cohort makes up around 8-9% of the population, there is a 46.2% likelihood that a Frail/Elderly patient is high cost, meaning that the patient falls in the top 10% of spend in a given year (see cost pyramid below). In addition, Jha and team found that the Frail/Elderly population accounts for 51.2% of the total preventable spending, which includes avoidable ED visits and inpatient stays that are related to AHRQ’s Prevention Quality Indicators.2 Especially for this segment of patients, not only are the avoidable visits costly, but more importantly, it has a negative impact on the quality of life of these patients and puts them at risk for developing other conditions at these acute facilities.
Calculating County Level Frail/Elderly Prevalence: An Interactive Dashboard
Fill out the form to the right to view Frail/Elderly prevalence rates by state and county for 2017 and 2018.
Using the 100% Medicare FFS claims dataset, we applied the high need high cost patient segmentation model at the patient zip code level, filtering where patient counts were greater than 100, then rolling up to the county level for this analysis. We also only included patients who were enrolled in Medicare for all 12 months of the calendar year, which removes about 20% of the Medicare FFS population. We know that this will cut off some patient counts, so the sum of patients in the dashboard will not reflect total Medicare FFS beneficiaries. Please reach out to jumpstart@carejourney.com with any additional questions on our assumptions. Please note that CMS constraints prevents us from providing data where the patient count is <11 patients.
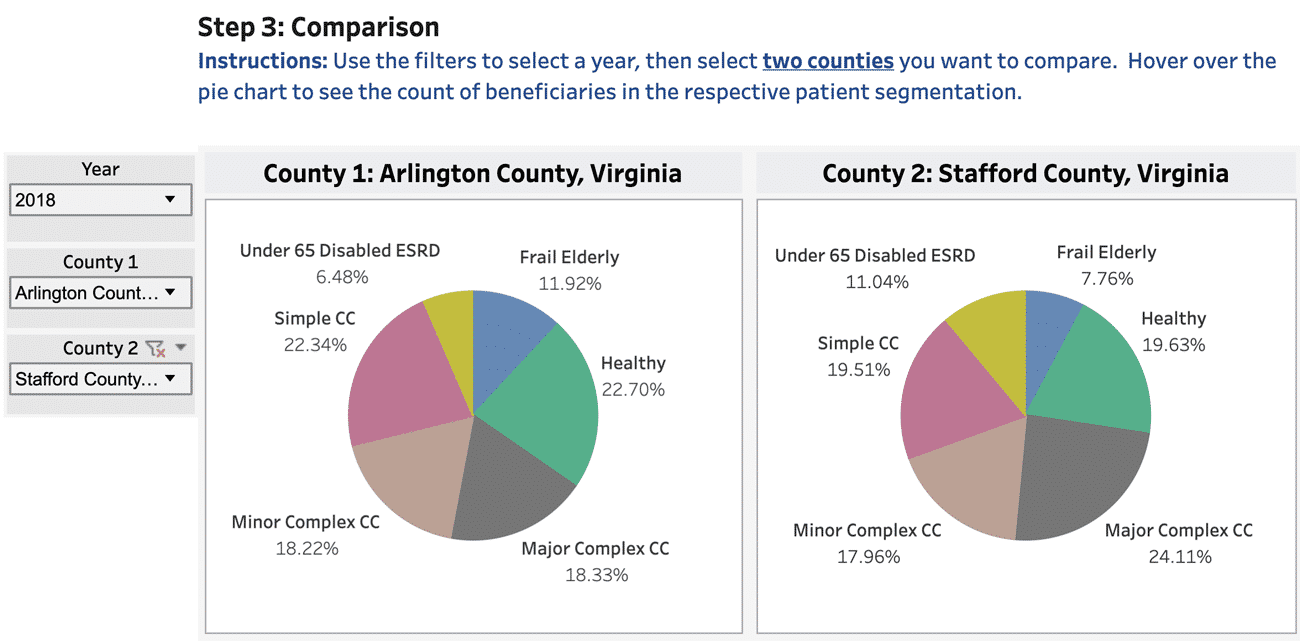
Comparing Arlington County with Regional and National Benchmarks
Taking a look at Virginia, where CareJourney is based, we can see that the Frail/Elderly population makes up around 8.4% of the Virginia Medicare FFS population, which is in line with Jha et al’s percentage of 8.6%.1 Within the state, however, we can see differences at the county level. Based on the state shading, we can see a larger number of Frail/Elderly patients in Northern Virginia, Richmond, and Virginia Beach area, which is in line with general population patterns as well.
To dive deeper at the difference in prevalence rates, rather than absolute number of patients, we can take a look at Arlington County, where CareJourney is based, and nearby Stafford County a short drive away. Looking at the relative percentage of Frail/Elderly and Major Complex Chronic patients in these counties, we can see why more granular cuts at a county level provide value when assessing an existing or future market. We can see that Arlington County has higher prevalence of Frail/Elderly patients (11.92% vs 7.76%), but a lower percentage of Major Complex Chronic patients (18.33% vs 24.11%). For organizations either servicing, or planning to service, the Arlington County area, it’s important that the organization has providers who have proven success managing the care of Frail/Elderly patients. For organizations either servicing, or planning to service, the Stafford County area, it’s important to see what these complex chronic conditions are (which CareJourney is able to calculate), and ensure that these patients are being treated by top performing specialists. So how does CareJourney assess provider performance on quality and cost?
Using the Provider Performance Index to Assess Providers in These Counties
Now that the dashboard gives an indication of Frail/Elderly prevalence, it’s important to also be able to evaluate providers in the counties as well. Do you have an adequate number PCPs or specialists to treat these patients? How do these PCPs care for Frail/Elderly patients from an outcomes and cost perspective?
Using our access to the 100% Medicare FFS data set, we have been able to develop a Provider Performance Index (PPI) that quantifies provider accountability for episodes of care, rather than individual treatments. Using over 56 million PCP, chronic condition, inpatient, and outpatient episodes a year, we compare each provider’s observed over expected spend with their peers of the same specialty and geography to give a score from 1 (low performing) to 5 (high performing) for cost and outcomes.
For a service area with many high-risk patients, whether that be Frail/Elderly patients or those with multiple chronic conditions, it’s important to have these high performing providers (the “5/5s”) to ensure effective care and also help set best practices for the area that can be shared across the network. For more details about our Provider Performance Index, please visit our PPI overview page.
Explore with CareJourney
Between the dashboards above and the Provider Performance Index overview, this leads to some exciting next steps that we tackle with our members each day:
- Which PCPs are these Frail/Elderly patients attributed to in your current or future network?
- What is driving the providers’ cost and outcomes spend? Is it a particular chronic condition or patient segment?
- What are quality and savings opportunity gaps that can help improve the care provided to these patients?
- What are actionable sub-cohorts of the Frail/Elderly population and what interventions exist to take better care of these patients?
We look forward to working with you to identify, implement, track, and share ways of identifying actionable cohorts of patients and the best clinical interventions to care for these patients. If you’re not a CareJourney member, email us at jumpstart@carejourney.com, or you can learn more by requesting a demo below.
Not a CareJourney member?
Request a demo
- Joynt KE, Figueroa JF, Beaulieu N, Wild RC, Orav EJ, Jha AK. Segmenting high-cost Medicare patients into potentially actionable cohorts. Healthc (Amst). 2017;5(1-2):62-67. doi:10.1016/j.hjdsi.2016.11.002
- Figueroa JF, Joynt Maddox KE, Beaulieu N, Wild RC, Jha AK. Concentration of Potentially Preventable Spending Among High-Cost Medicare Subpopulations: An Observational Study. Ann Intern Med. 2017;167(10):706-713. doi:10.7326/M17-0767