Trends in Characteristics of Fee-For-Service Medicare and Medicare Advantage Enrollees
By Anna Wang, PhD, Senior Analyst, CareJourney and Bill Weeks, MD, PhD, MBA, Senior Principal Research Manager at Microsoft Health
February 14, 2022
Background
Medicare Part C (Medicare Advantage) enrollment has grown more rapidly than fee-for-service Medicare Enrollment in the last decade, raising questions about changes in the characteristics of different enrollee populations for Medicare Part A only, Medicare Part A & B and Medicare Part C. Microsoft’s Precision Population Health Group partnered with CareJourney to advance understanding of the changes of these three different enrollment types by leveraging the 100% All Medicare Eligibility Enrollment data that CareJourney has access to through its Center for Medicare and Medicaid Services (CMS) Virtual Research Data Center (VRDC).
Method
We used 2011-2019 Medicare Eligibility Enrollment files to identify Medicare beneficiaries and classify them into three enrollment types: Medicare Part A only, Medicare Part A and B, and Medicare Part C. We analyzed two age groups: those younger than 65 and those age 65 and older. For each Medicare enrollment type and age group, we calculated the number of enrollees, the mean age of enrollees, the proportion of enrollees who were female, the proportion of enrollees who were black, the proportion of those concurrently enrolled in Medicaid, and the proportion whose initial reason for Medicare eligibility was old age and survivor’s benefit.
Findings
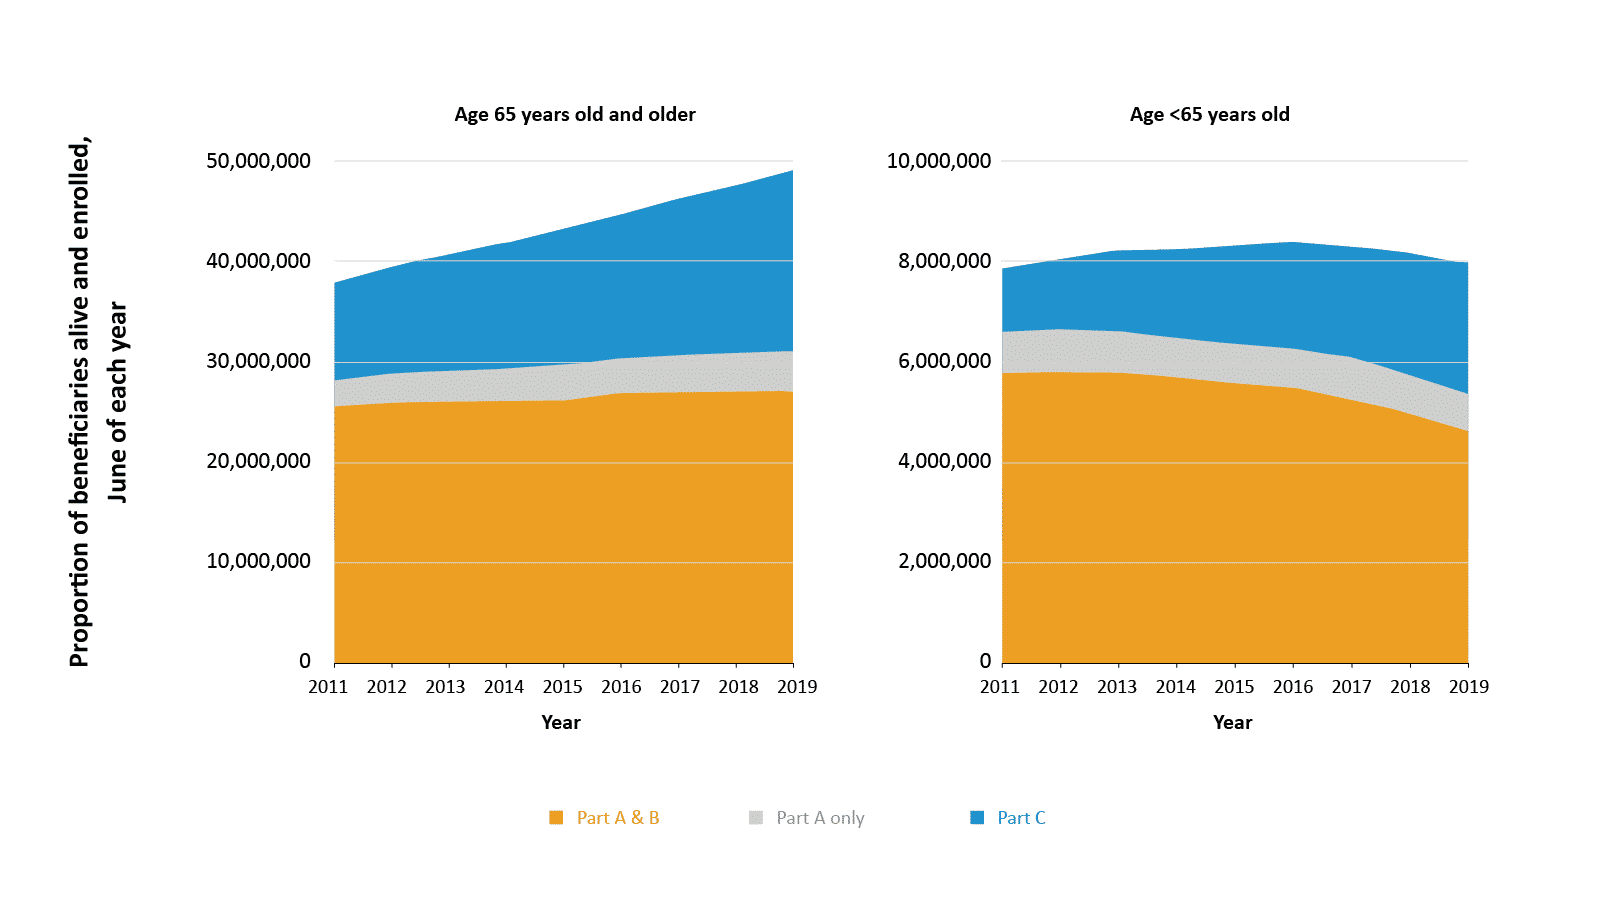
Figure 1. For older and younger Medicare beneficiaries, enrollment in Medicare Parts A & B (lower gold band), Part A only (middle gold band) and Part C (upper blue band), 2011-2019.
Figure 1 shows that, between 2011-2019, the number of all Medicare Enrollees increased 29.8% for those aged 65 and older, but remained relatively stagnant for those younger than 65, increasing only 1.49% during that time period. Among these three enrollment types, Part C enrollment grew the fastest at 85% over the 9 years.
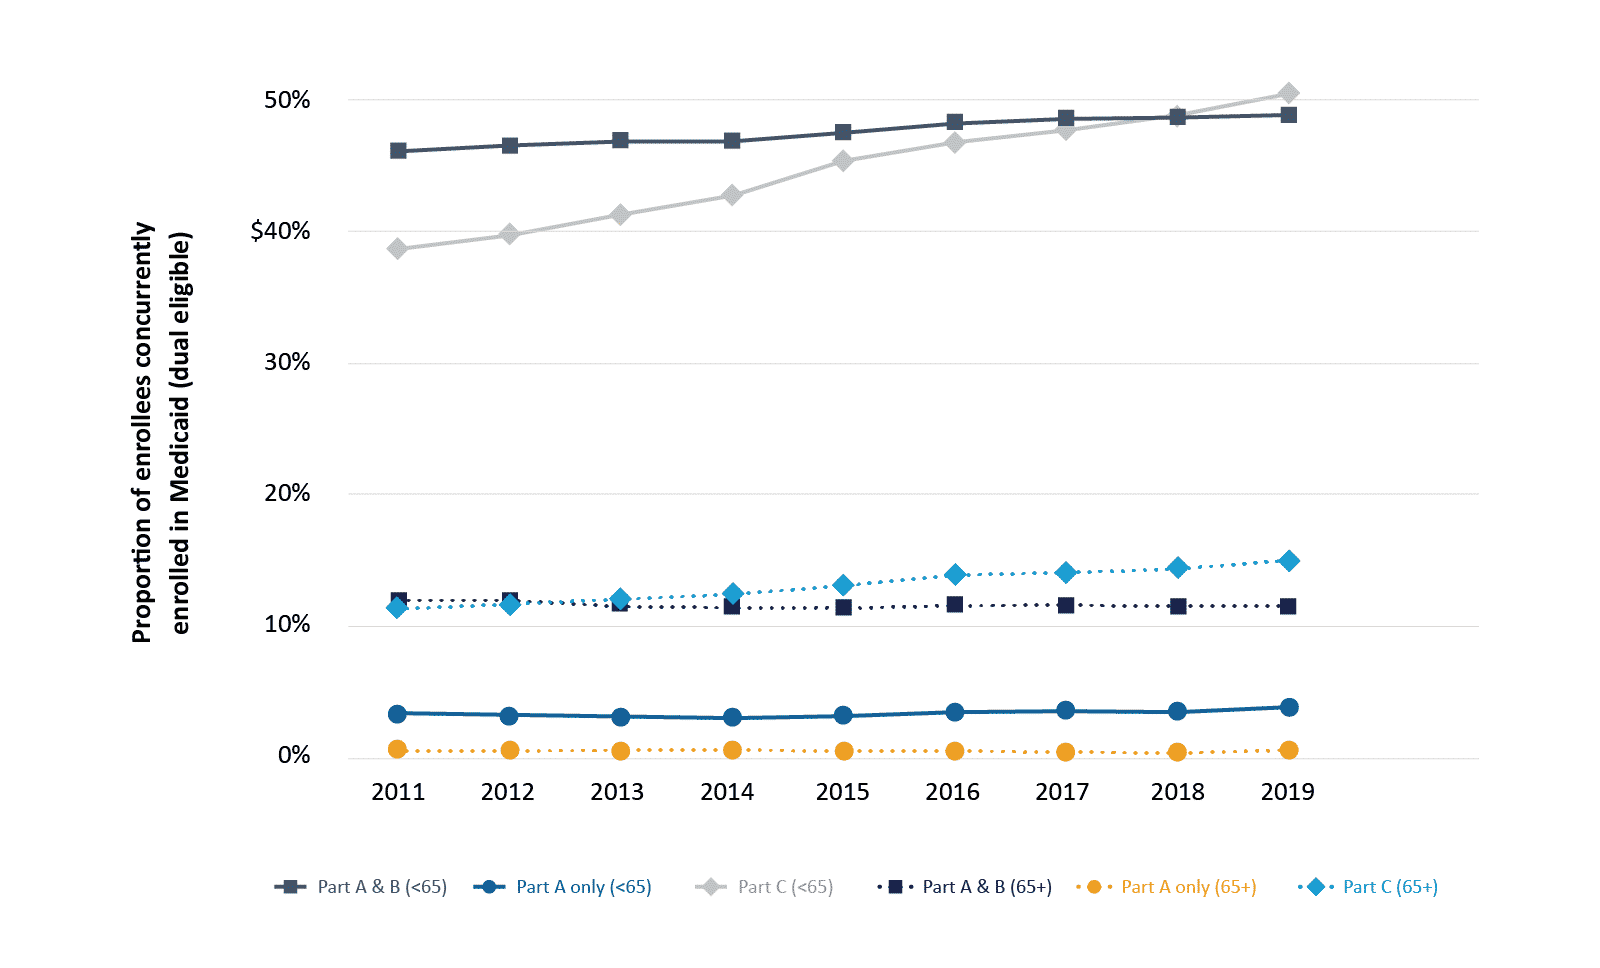
Figure 2. Proportion of younger (younger than 65 years old, solid lines) and older (65 years and older, dotted lines) Medicare Part A only (circle), Part A & B (square), and Part C (diamond) enrollees concurrently eligible for Medicaid (dual-eligible), 2011-2019.
The proportion of the Dual Eligible (Beneficiaries enrolled in both Medicaid and Medicare) population for Part C enrollment type increased from 11.4% to 15.0% for older enrollees and from 38.6% to 50.5% for younger enrollees whereas the proportion of Dual Eligible beneficiaries for Part A & B and Part A only was relatively flat. In general, older patients were far more likely to be dual-eligible. (Figure 2)
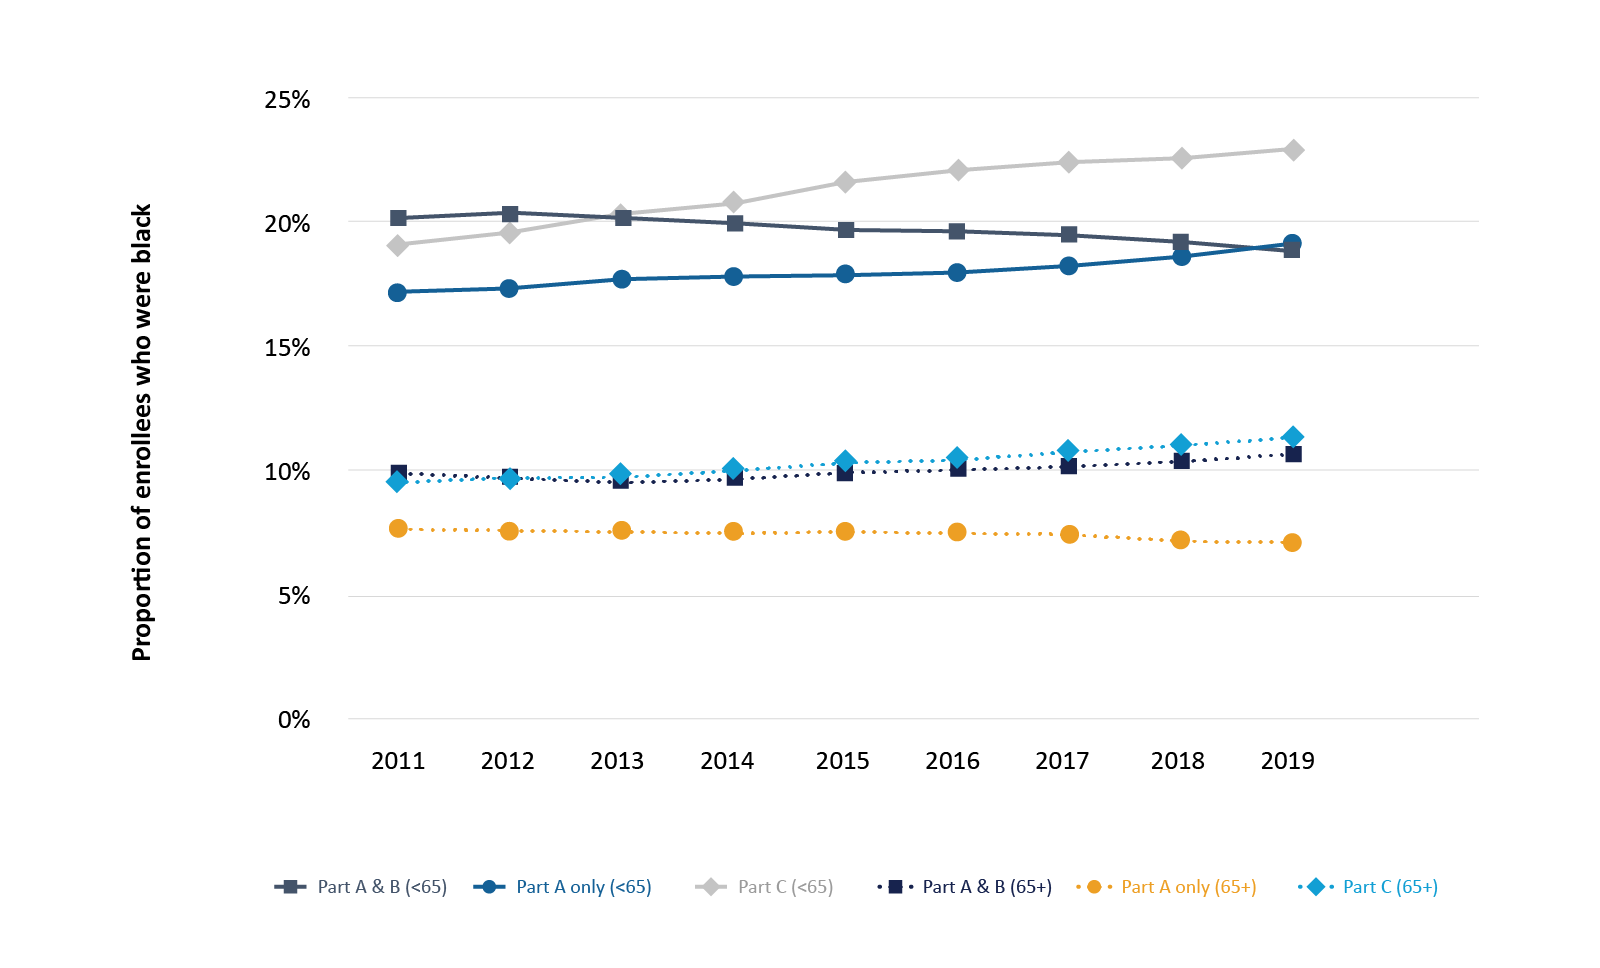
Figure 3. Proportion of younger (younger than 65 years old, solid lines) and older (65 years and older, dotted lines) Medicare Part A only (circle), Part A & B (square), and Part C (diamond) enrollees who were black, 2011-2019.
The proportion of Part C enrollees who were black enrollees increased for both older (from 9.6% to 11.4%) and younger (from 19.1% to 22.9%) populations. Among Part A & B enrollees, we found a downward trend for both older (from 7.7% to 7.1%) and younger (from 20.2% to 18.9%) enrollees. Between 2011-2019, the proportion of Part A only enrollees who were black increased slightly for both older (from 10.0% to 10.7%) and younger (from 17.2% to 19.2%) enrollees. (Figure 3)
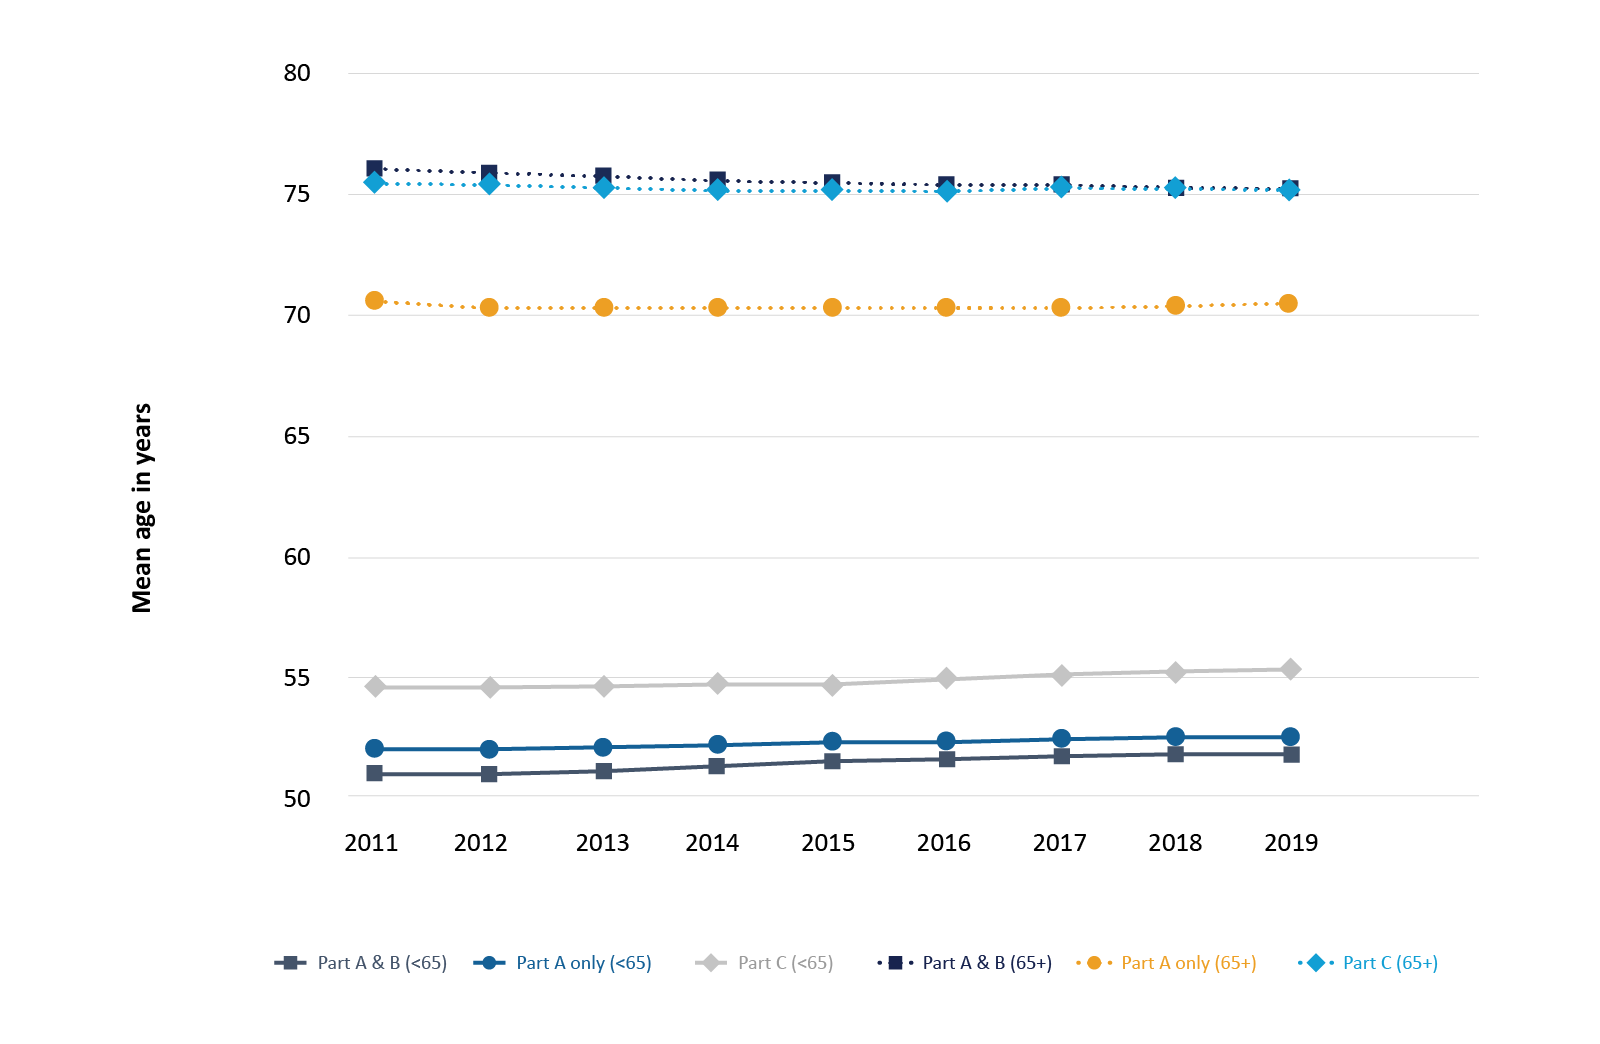
Figure 4. Mean age of younger (younger than 65 years old, solid lines) and older (65 years and older, dotted lines) Medicare Part A only (circle), Part A & B (square), and Part C (diamond) enrollees, 2011-2019.
The mean age of younger enrollees for all three enrollment groups increased; however, that for older enrollees decreased except for Part A only, where mean age increased slightly from 2017 to 2019. (Figure 4)
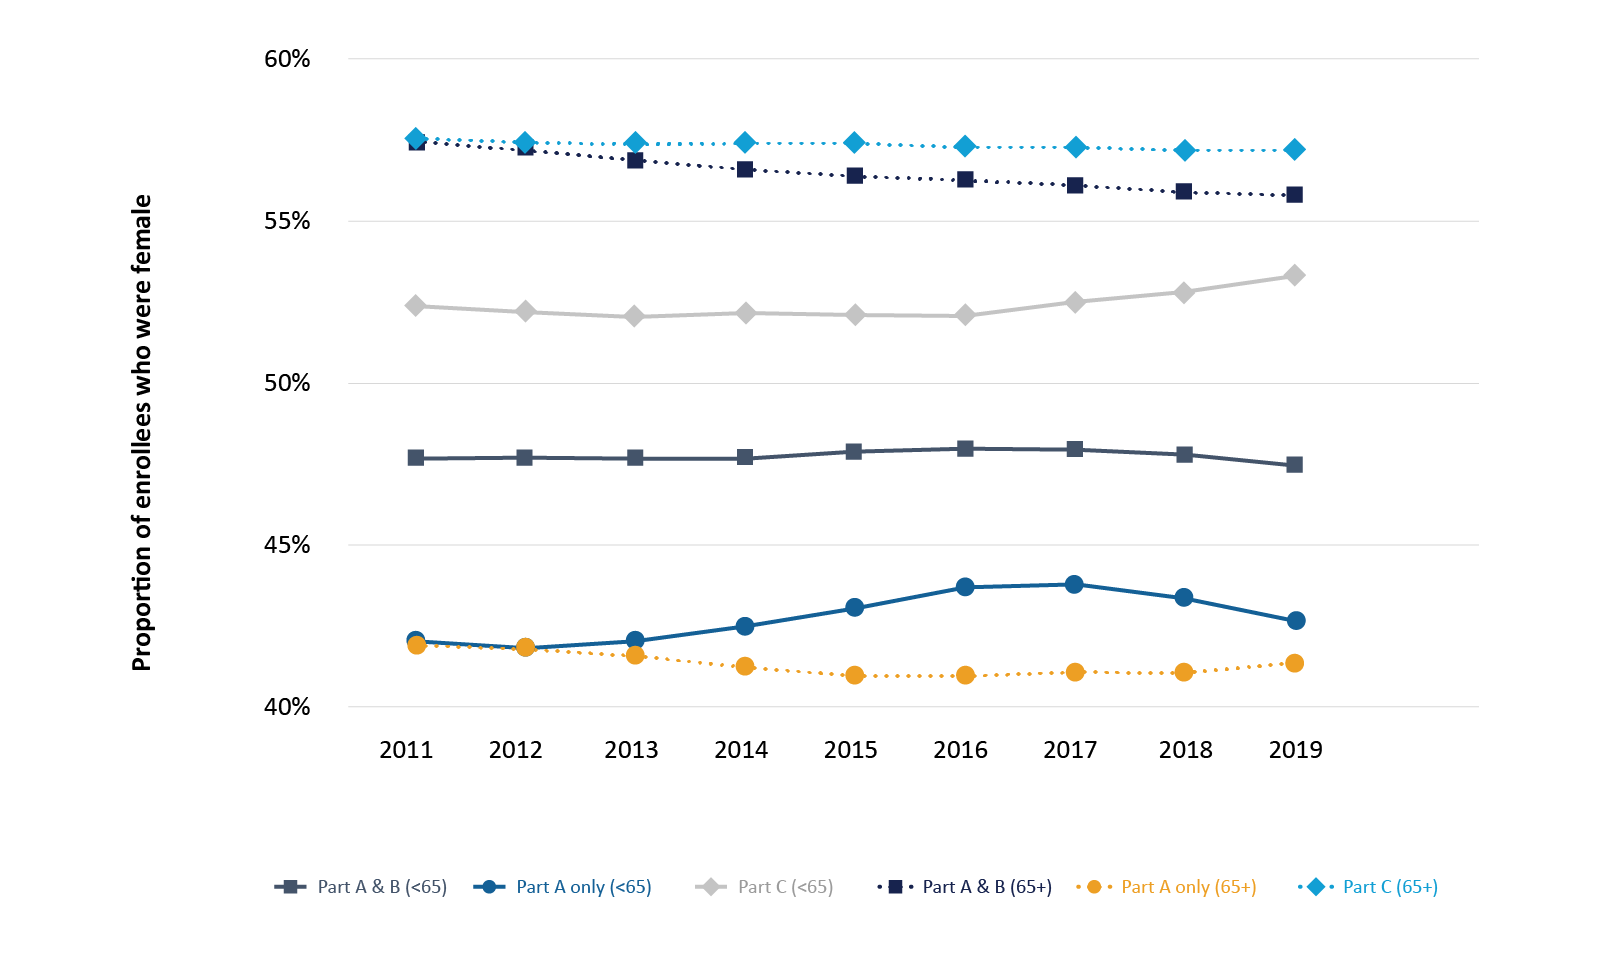
Figure 5. Proportion of younger (younger than 65 years old, solid lines) and older (65 years and older, dotted lines) Medicare Part A only (circle), Part A & B (square), and Part C (diamond) enrollees who were female, 2011-2019.
Figure 5 shows that the proportion of enrollees whose initial reason for Medicare eligibility was old age and survivor’s benefit decreased for all plan types except for Part C enrollees.
Next Step
Over the last decade, Medicare Part C enrollment far outpaced that in Part A and Part B Medicare. This is partially because more Americans aged 65 and older are remaining employed and elimination of late Part B Enrollment Penalties may have encouraged such enrollment. Future research should explore care equity, quality, and cost among different Medicare enrollment types.
In addition to Medicare FFS and Medicare Advantage datasets, CareJourney also has access to data on both the Commercial and Medicaid populations. Layering in additional populations to this analysis can generate regional benchmark measures for network managers and help inform network builders on the size of national and regional markets, broken down by payer.
Explore with CareJourney
If you are interested in understanding how CareJourney analytics can help with your organization’s assessment of geographic variation, we want to hear from you. Current members can reach out to their CareJourney representative for more information. Non-members can email us and check out our resources to learn how we help payer, provider, and pharma organizations reduce the total cost of care and improve care quality.
- Weeks WB, Cao SY, Smith J, Wang H, Weinstein JN. Trends in characteristics of adults enrolled in traditional fee-for-service Medicare and Medicare Advantage, 2011-2019. Medical Care, Jan, 2022
- Source of Figure 1 – Figure 5 is from Trends in characteristics of adults enrolled in traditional fee-for-service Medicare and Medicare Advantage, 2011-2019. Medical Care, Jan, 2022
