With the changing healthcare landscape that is moving towards value, it is imperative for organizations to find and recruit high performing providers that will continue to drive high quality care at a lower cost. One of the ways to provide high-quality and efficient care is to build and expand your high-performance networks (HPNs). However, health care organizations often face multiple challenges when trying to build an effective HPN strategy. A few of the most common challenges include:
- Limited access to comprehensive and reliable data to measure cost and quality, market intelligence, and benchmarks.
- Lack of tested and proven, transparent methodologies for measuring performance.
- Low physician engagement and physician leadership buy-in for standardized metrics around cost and outcomes.
In order to help organizations answer critical business questions, we’ve designed a simple playbook to walk you through the 3 key steps of building an HPN and how CareJourney can help.
Before diving into the steps, here are a few general questions to consider to help guide your decision making:
- Are you entering a new market, expanding in a current market, or refining your current network?
- What do you want your network to accomplish?
- What is the end goal? Are you interested in PCPs, specialists or both?
Step 1: Assess the Market
Whether you are focused on network expansion or refinement, here are some questions you need to address:
- What markets and populations do you need to consider to grow over the next 5 years?
- How many patients are there in the market of interest? Are these patients high risk?
- What does PMPY look like?
- How do I benchmark against my competitors’ networks in terms of their contracted providers, cost and quality metrics, and referral patterns?
Build a New Network
To inform your network building and growth decisions, you need actionable market intelligence to understand market and competitor dynamics – geographic concentrations of patient activity, utilization by specialty or practice groups, and network affiliations – to design competitive rates and contract terms. You also need the ability to easily and quickly simulate the impact of different combinations of providers on total network performance.
How We Help
CareJourney offers a comprehensive Market Overview dashboard to help you compare core-based statistical areas (CBSA) across the country to one another as well as drill-down into a specific CBSA of interest and assess the market share of practice groups and facilities in that region. We also provide you the ability to match patients to the right providers and care settings and simulate the impact of different combinations of providers on total network performance.
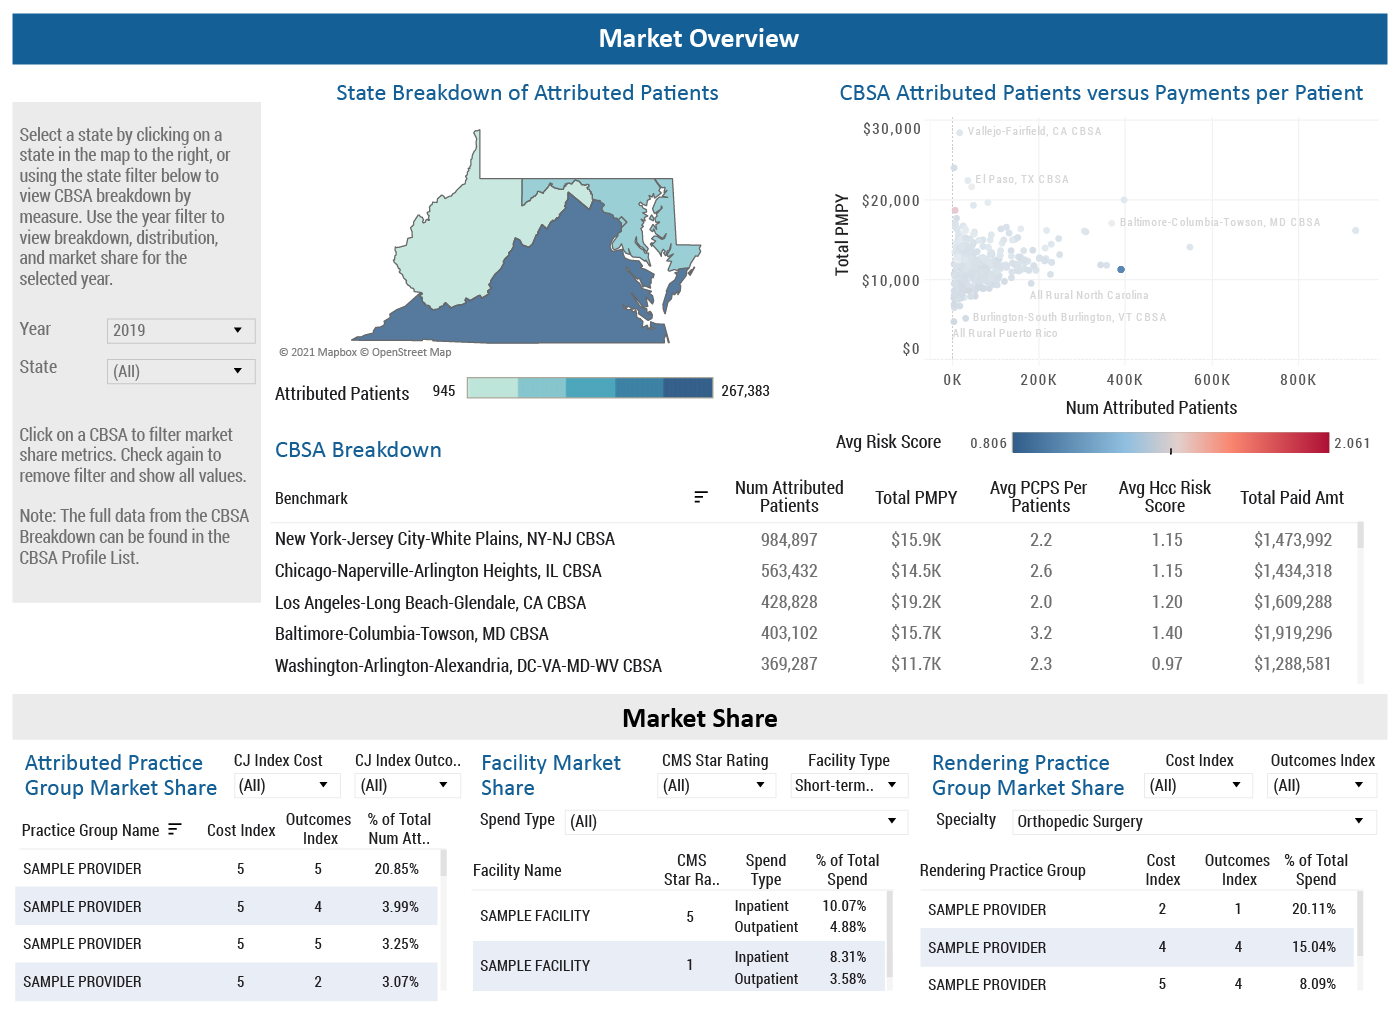
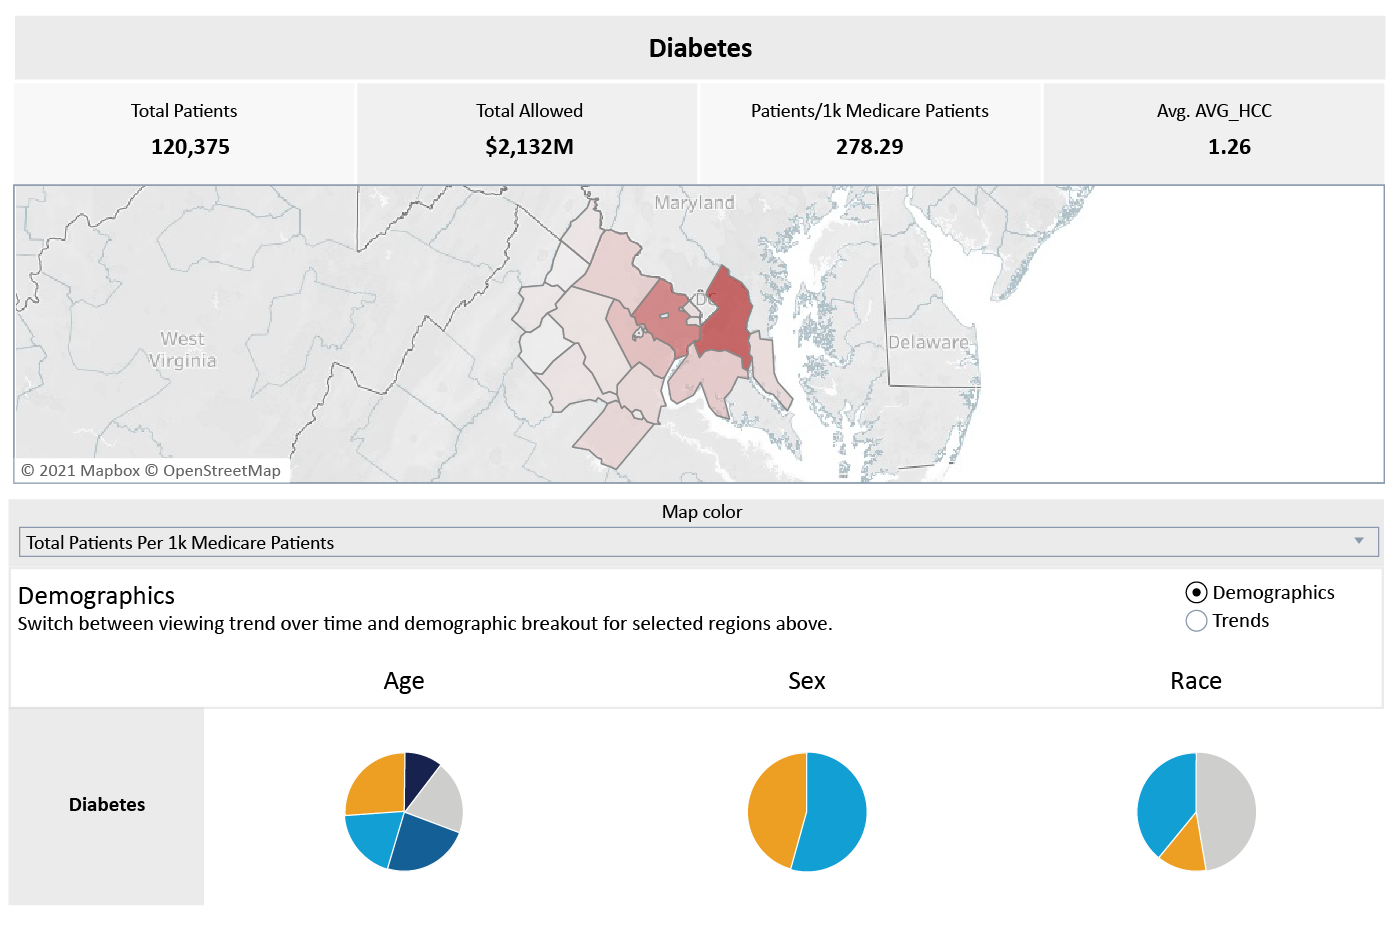
Along with the market insights at the provider and practice group level, above, CareJourney also has a similar analysis at the cohort level. The example below highlights the ability to evaluate a given market for prevalence rates as well as cost and utilization for the diabetes cohort. Along with diabetes, there are patient cohorts for breast cancer, hypertension, and Alzheimers amongst others. This data is provider agnostic but can steer you in the direction of what types of providers you should be looking for based on prevalence rates in the market of interest.
Expand Current Network
Network Expansion may include either expanding into a completely new or adjacent market or expanding upon an existing market. When doing this, there are two main questions to consider:
- Am I looking to expand my PCP network?
- Am I trying to expand my specialist referral network?
Regardless of which path is of focus, it is important to be aligned on what quality and utilization metrics are of highest priority when evaluating provider alignment with your network.
If PCPs are of interest, some of these key measures will include:
- Number of attributed patients
- PMPY
- Utilization rates (IP, SNF, readmissions, avoidable ED, etc)
- Care model compliance (AWV, TCM, Flu, etc)
- Provider cost index
- Provider outcomes index
For Specialists, additional key metrics include:
- Total patients
- Frailty segmentation
- Provider cost index
- Provider outcomes index
How We Help
CareJourney provides over 300 metrics for your region, providers, and patient population. Using the custom sorting and filtering functionality, metrics can be combined to create a provider list based on high priority metrics.
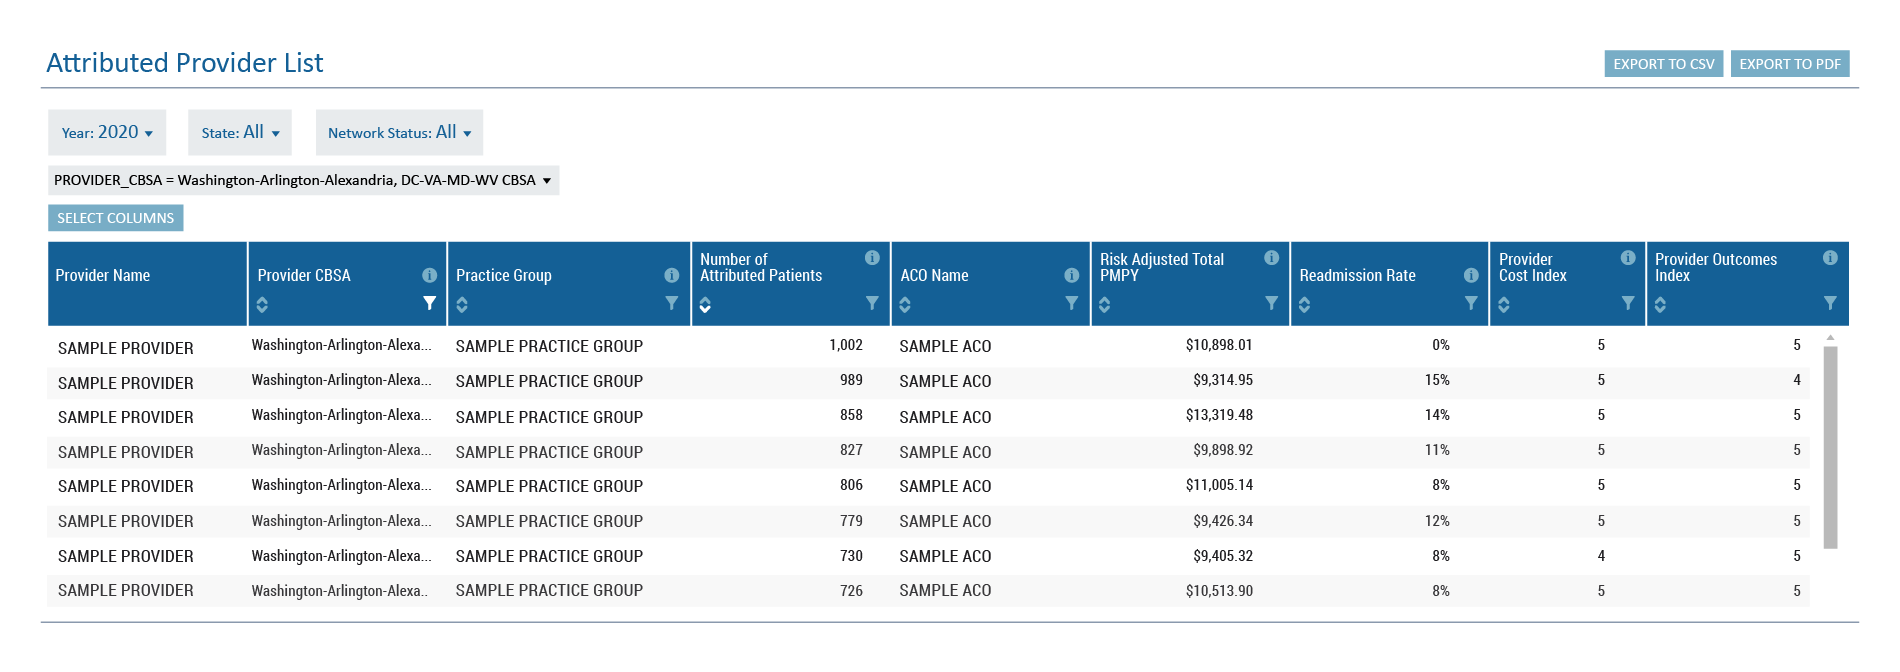
CareJourney’s Provider Performance Index (PPI) helps with evaluating providers. The PPI scores providers on cost and outcomes on a scale of 1-5, with 5 being the most favorable, to reflect the scale used by CMS for facility star ratings. It is calculated by benchmarking, combining, and risk-adjusting episode cost for each physician. The PPI can then be aggregated from the physician-level to practice groups, care teams, networks, and markets to create benchmarks for performance based on peer groups, level, or geography. Read this whitepaper to learn more about the CareJourney PPI or learn how it helps leading healthcare organizations succeed in value-based care.
Step 2: Recruit Top Providers
When recruiting practice groups or providers into your network, it is imperative to highlight your strengths and what differentiates you from the competition.
How We Help
CareJourney gives you a 360 degree view of providers in and out of your network with details of existing provider affiliations and complete provider profiles for over 2M+ PCPs and specialists to identify the high value providers to include in your network.
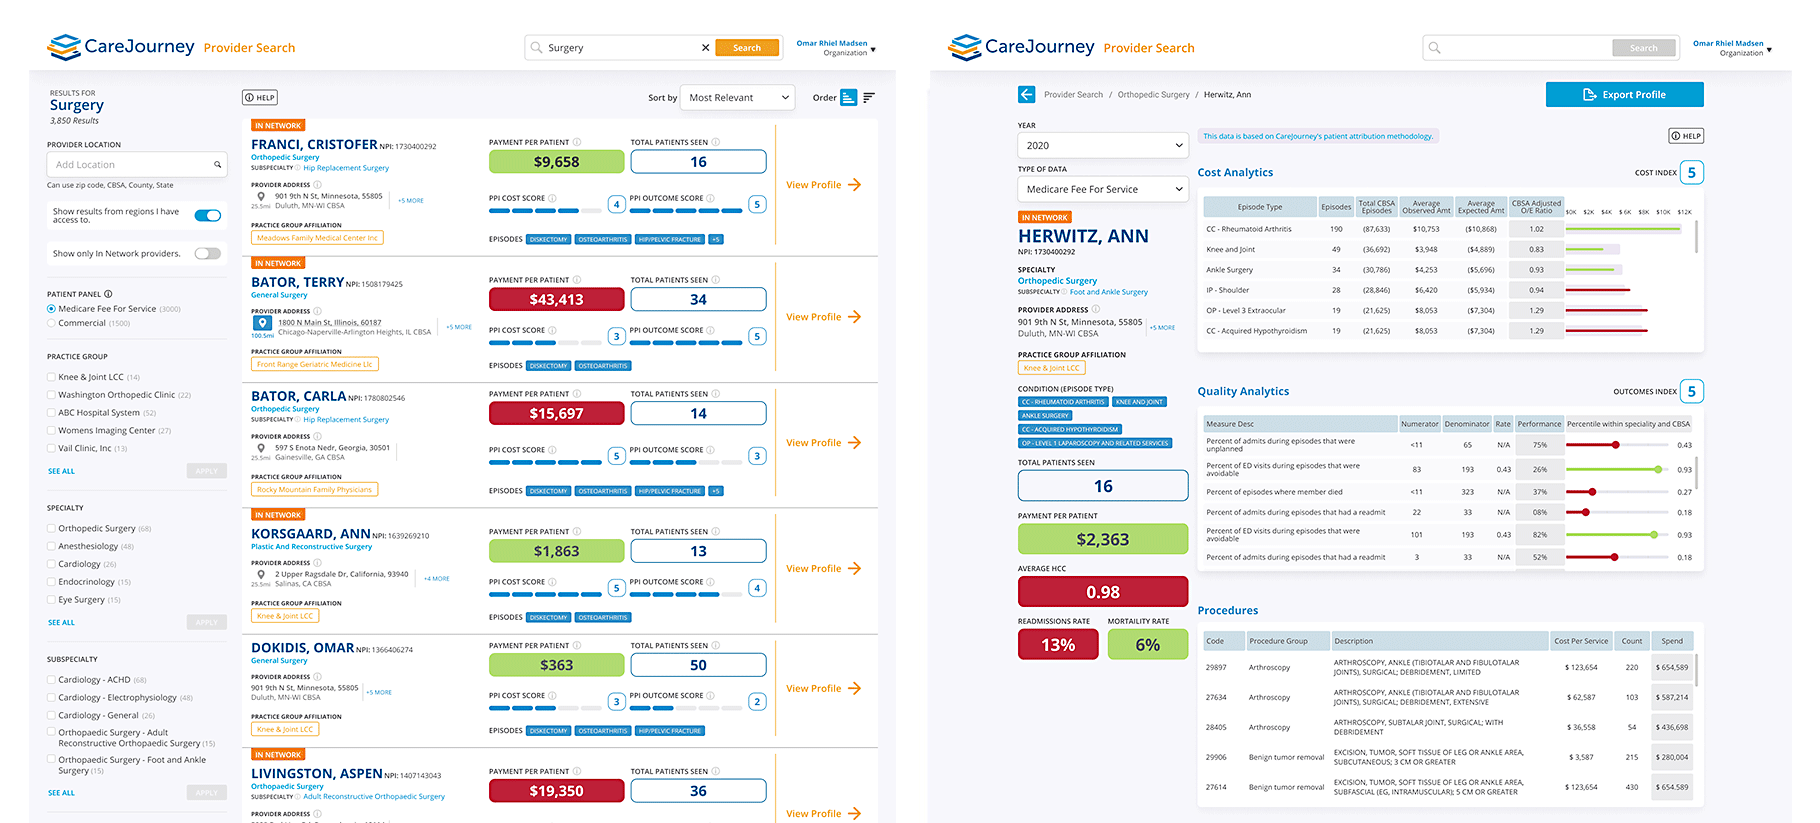
Our powerful Provider Search tool compiles all the relevant provider data into one single user interface to help you find critical information about any provider such as their NPI and address, specialty and subspecialty, top conditions treated. You can also view their current and historical performance metrics and benchmarks – including cost, utilization, and outcome metrics, as well as their referral patterns. You can filter and sort these results to quickly narrow down the list that is most relevant to your needs. You can also easily identify which providers are in and out-of-network.
Step 3: Refine Your Network Over Time
In order to refine your networks over time and improve performance, you need to understand utilization patterns, bundle performance, and track referral patterns.
Questions you need to address:
- What are my biggest areas of opportunity to improve physician alignment and strengthen network integrity?
- What performance metrics am I prioritizing when evaluating my current in- network providers?
- What do referral patterns look like across my network?
In order to partner with your providers on this continuous improvement journey, you must share and empower them with benchmarks and performance data at the point of care. When physicians and nurses have clean, reliable data to guide their decisions, they are able to steer patients to the best performing providers and specialists. Here is a case study of our member, Universal Health Services, that empowered their physicians with data at the point-of-care.
How We Help
Similar to the example shared above for expanding your network, CareJourney allows you to identify and evaluate current in-network providers across over 300 cost and outcomes measures. This list can be filtered and sorted to easily assess the performance of your providers across metrics of high importance.
Our Provider scorecards take you a layer deeper and provide insight into why providers have the cost and outcomes index scores that they do.
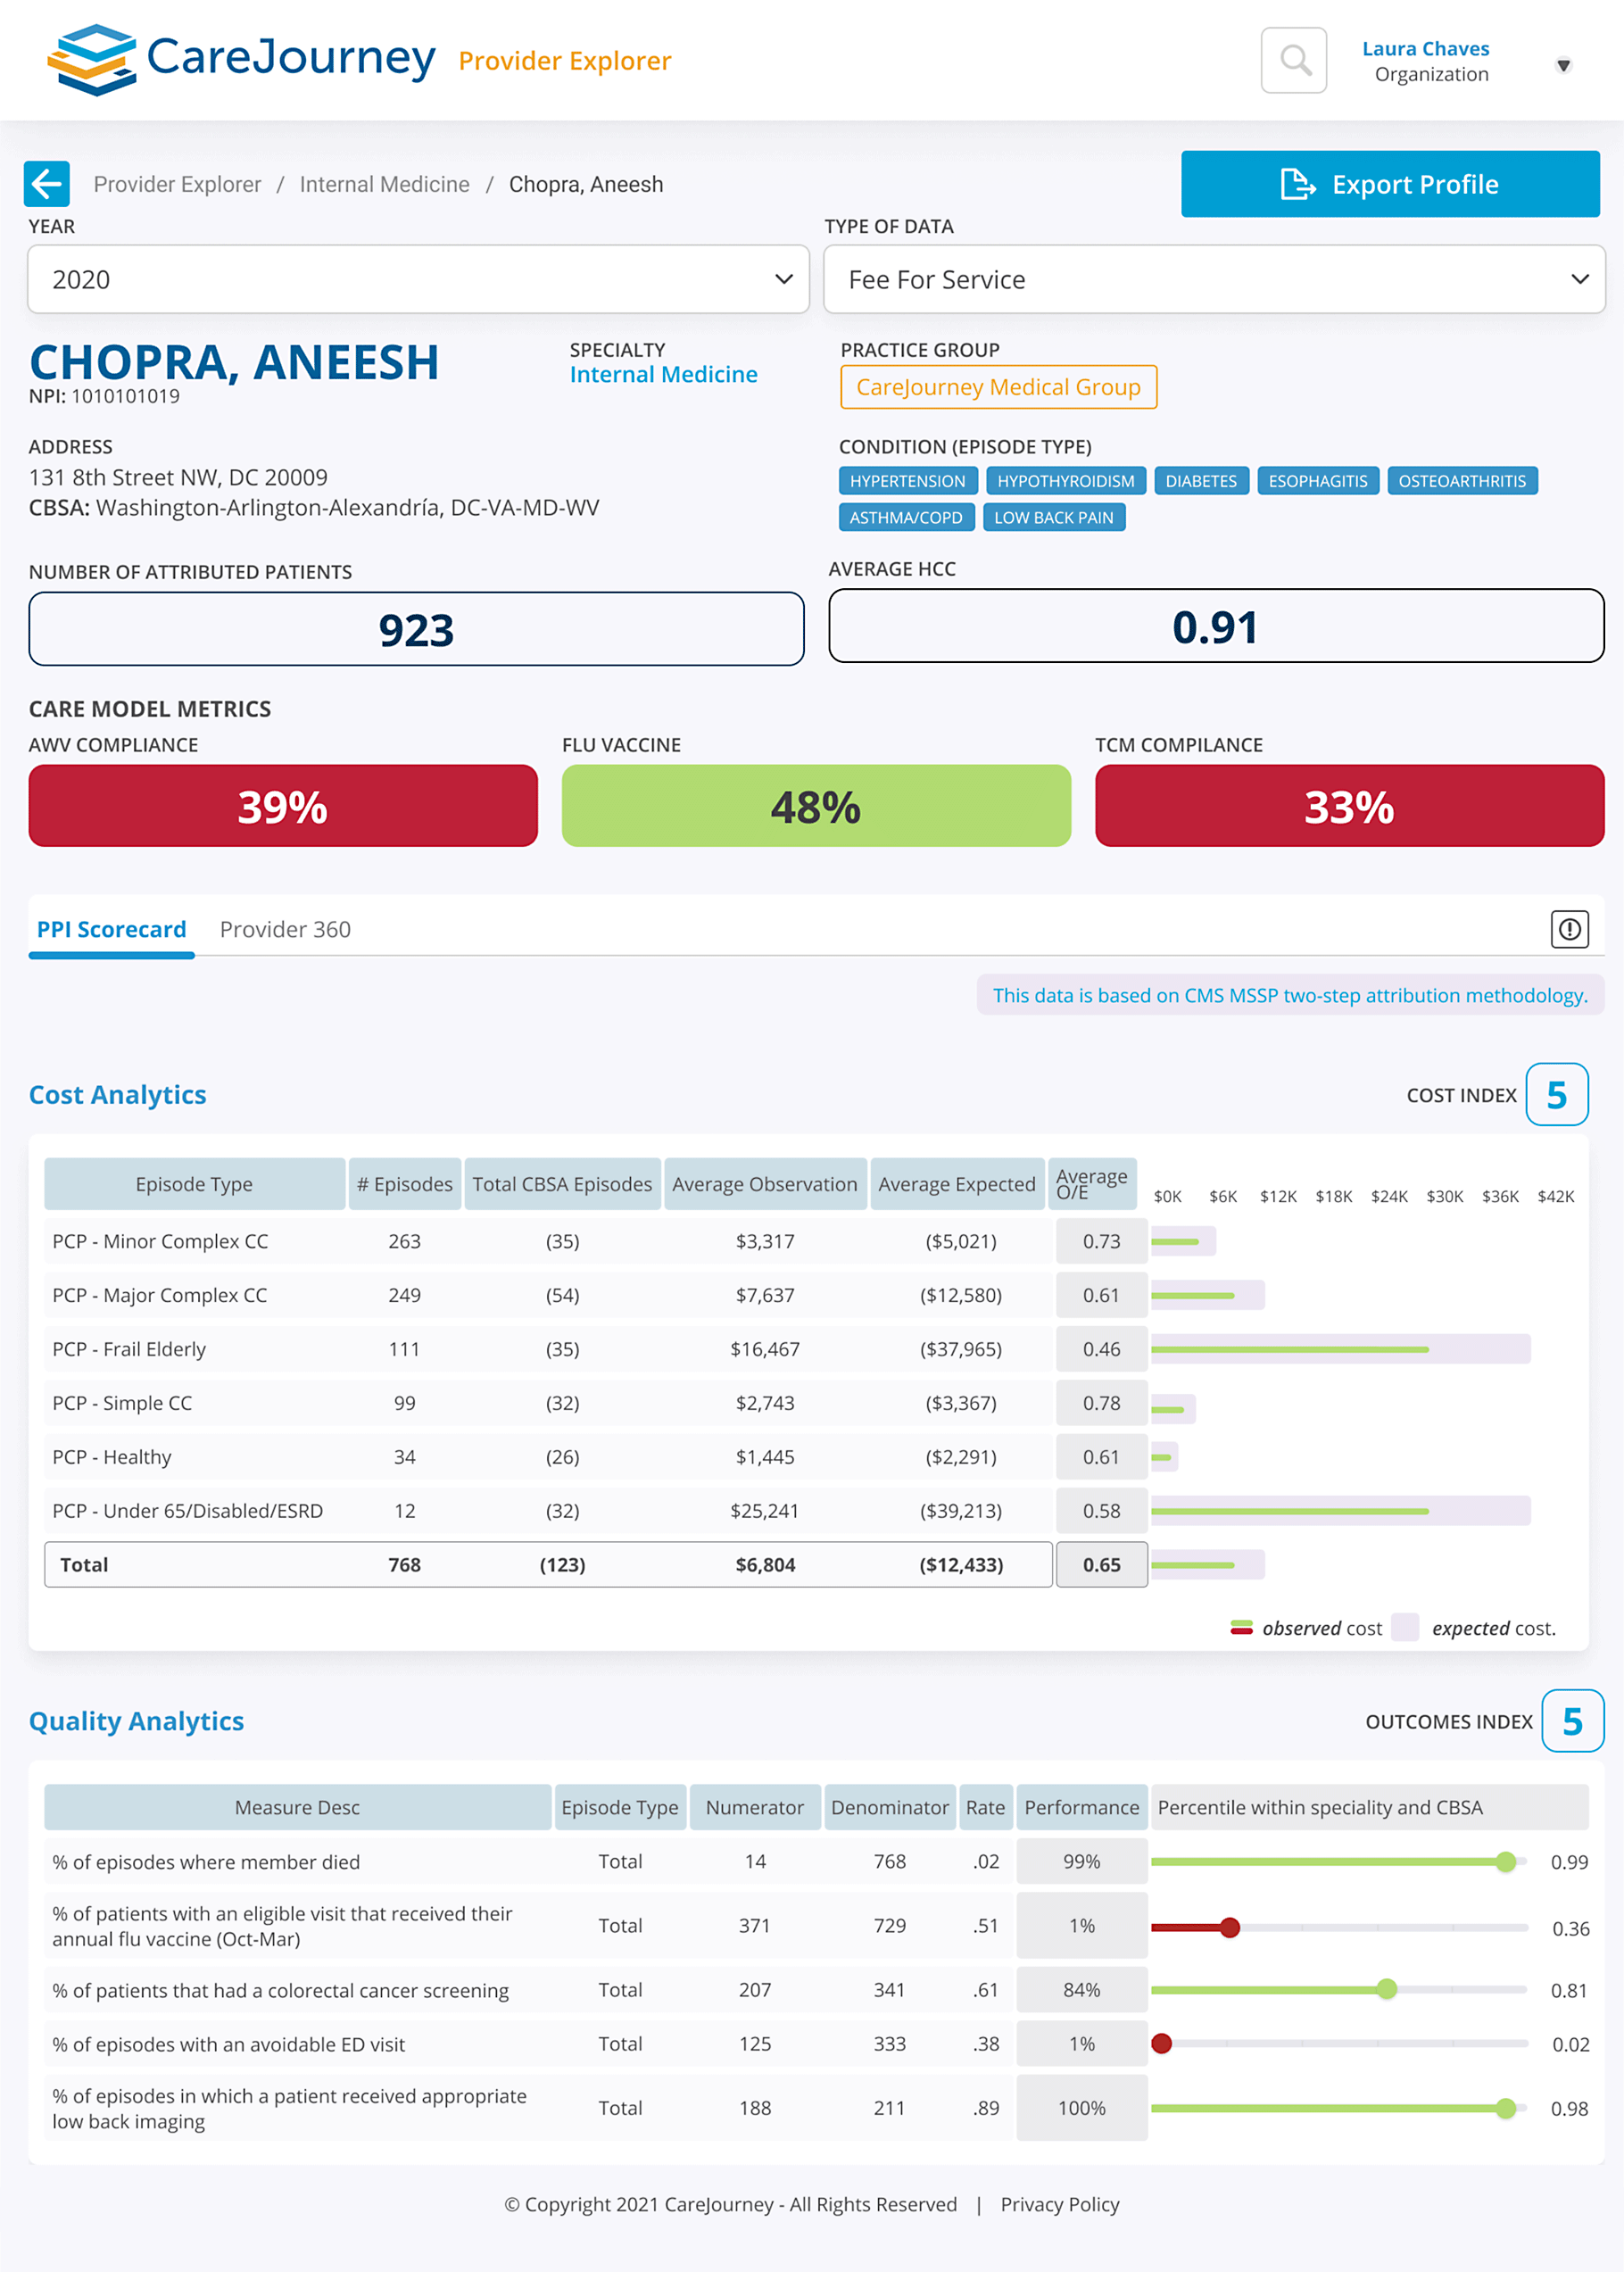
In the example below, Dr. Chopra is an Internal Medicine doctor that has a cost index of five and an outcomes index of five. From a cost perspective, Dr. Chopra is outperforming the expected cost for every type of episode that he’s treating. That’s highlighted with his strongest performance coming with the Frail/Elderly population, which is typically the most expensive segment of patients. This culminates in him being below the expected cost and ultimately a high performer overall.
For quality outcomes, Dr. Chopra is performing well on mortality rate, colorectal cancer screening, and appropriate low back imaging. Despite the fact that he could improve his performance for flu vaccine distribution and avoidable ED visits, Dr. Chopra has an outcomes index of five and is a high performing Internal Medicine doctor in the Washington, DC area.
CareJourney can also help refine your network and reassess the market from the cohort perspective. In the example below, the Acute Myocardial Infarction (AMI) population in the Miami, FL area saw a substantial increase in PMPY going from $84,002 in 2018 to $99,452 in 2019*. This data would allow an organization to make sure that they have enough providers working with the AMI population to address the increase in spend and/or utilization. While this is just one example, any patient population could be plugged in such as diabetes, CHF, Alzheimers, or asthma. Watching trends for different patient populations can be a great tool when refining your network to make sure that you are appropriately staffed for the high-volume cohorts in your region.
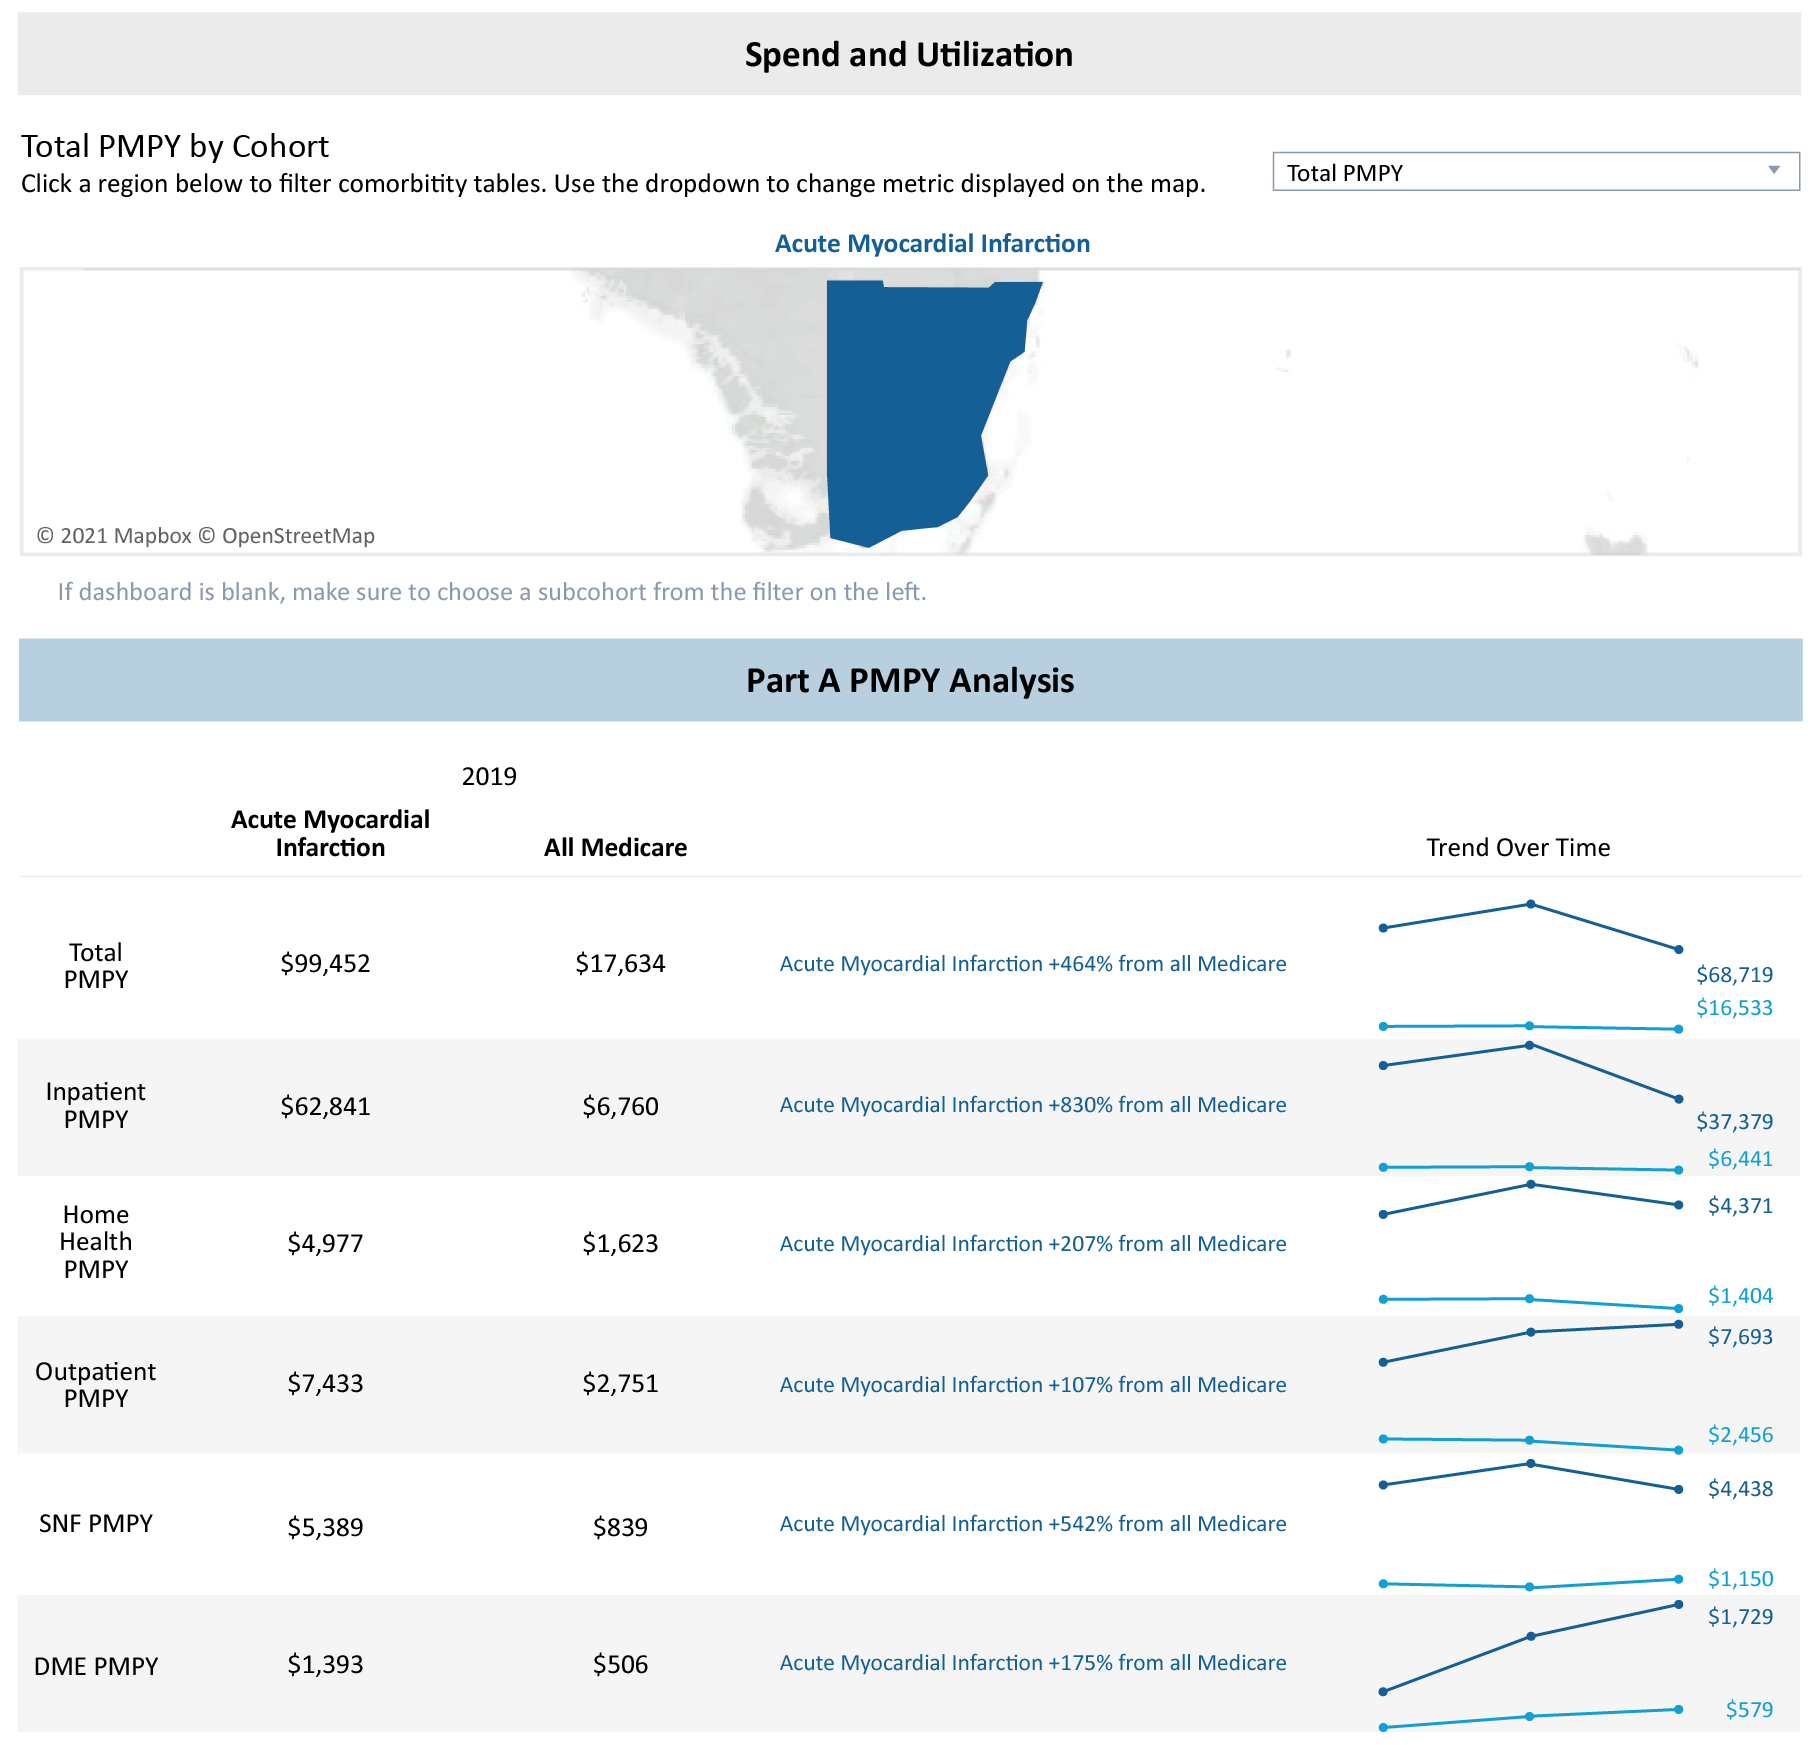
*Please note that 2020 data is not complete yet at this point, which is why we are seeing a drop off for 2020
Explore with CareJourney
As you begin or continue the process of building and refining your network, request a meeting with our experts to:
- Identify prospective practice groups and providers to bring into your network,
- Evaluate your current provider network,
- Simulate network performance with prospective practice groups and providers.
Not ready for a meeting? Check out our resources to learn how CareJourney helps payer, provider, and pharma organizations reduce the total cost of care and improve care quality.
