Setting the Background and Purpose of the ET3 Program
In an effort to increase the quality of care for patients and reduce avoidable transports to the ED, the Center for Medicare and Medicaid Innovation (CMMI) developed an innovative payment model called Emergency Triage, Treat, and Transport, or ET3 for short. This model really looks to redefine emergency ground ambulance services, who until this model would only be paid by Medicare when transporting patients to approved facilities including hospitals (EDs), even if this was not the most appropriate care setting for the patient’s need.
To set a “price tag” on these unnecessary ambulance transports to the ED, a recent Whitepaper from the U.S. Department of Health and Human Services and Transportation found that Medicare could save $560 million a year by transporting patients to a doctor’s office rather than the ED when appropriate. More importantly, by transporting patients to a more appropriate care setting, patients will have greater options for care and avoid unnecessary visits to the hospital, potentially exposing them to additional complications. Ambulance-sourced ED visits can also be reserved for higher acuity patients in more emergent scenarios.
Diving into the ET3 Model Details
While CMS has the details of the ET3 model listed on their website, it’s important to highlight some of the model logistics before diving into our country-wide analysis. The table below helps give additional insights into the ET3 model:
| Who | The participants of the ET3 program will be Medicare-enrolled ambulance providers and hospital-owned ambulance providers. In addition, local governments will be integral as 911 dispatch plays an important role in the model intervention. |
| What | This model will pay ambulance providers not just for transport to the ED, but also transports to alternative locations like a doctor’s office or an urgent care facility. While not required, providers also have the ability to treat patients in place through onsite or telehealth services. |
| Where | Applicants from over 35 states have been invited to participate in the ET3 model. A list of invited counties and participants can be found on the ET3 site linked here. |
| When | The start of the ET3 model was delayed due to COVID-19, but the first performance period officially started January 1, 2021. |
| Why | By allowing ambulance providers to be paid for treating or transporting patients to the appropriate care setting rather than the ED by default, patients are able to have more options for proper levels of care and avoid unnecessary ED visits. Not only will this encourage patients to consider other care settings in the future, but this has the ability to save Medicare millions of dollars. |
| How | The graphic from CMS below provides a concise overview of how the ET3 model works, and the additional flexibility for ambulance providers to have multiple paths for optimizing patient care. |
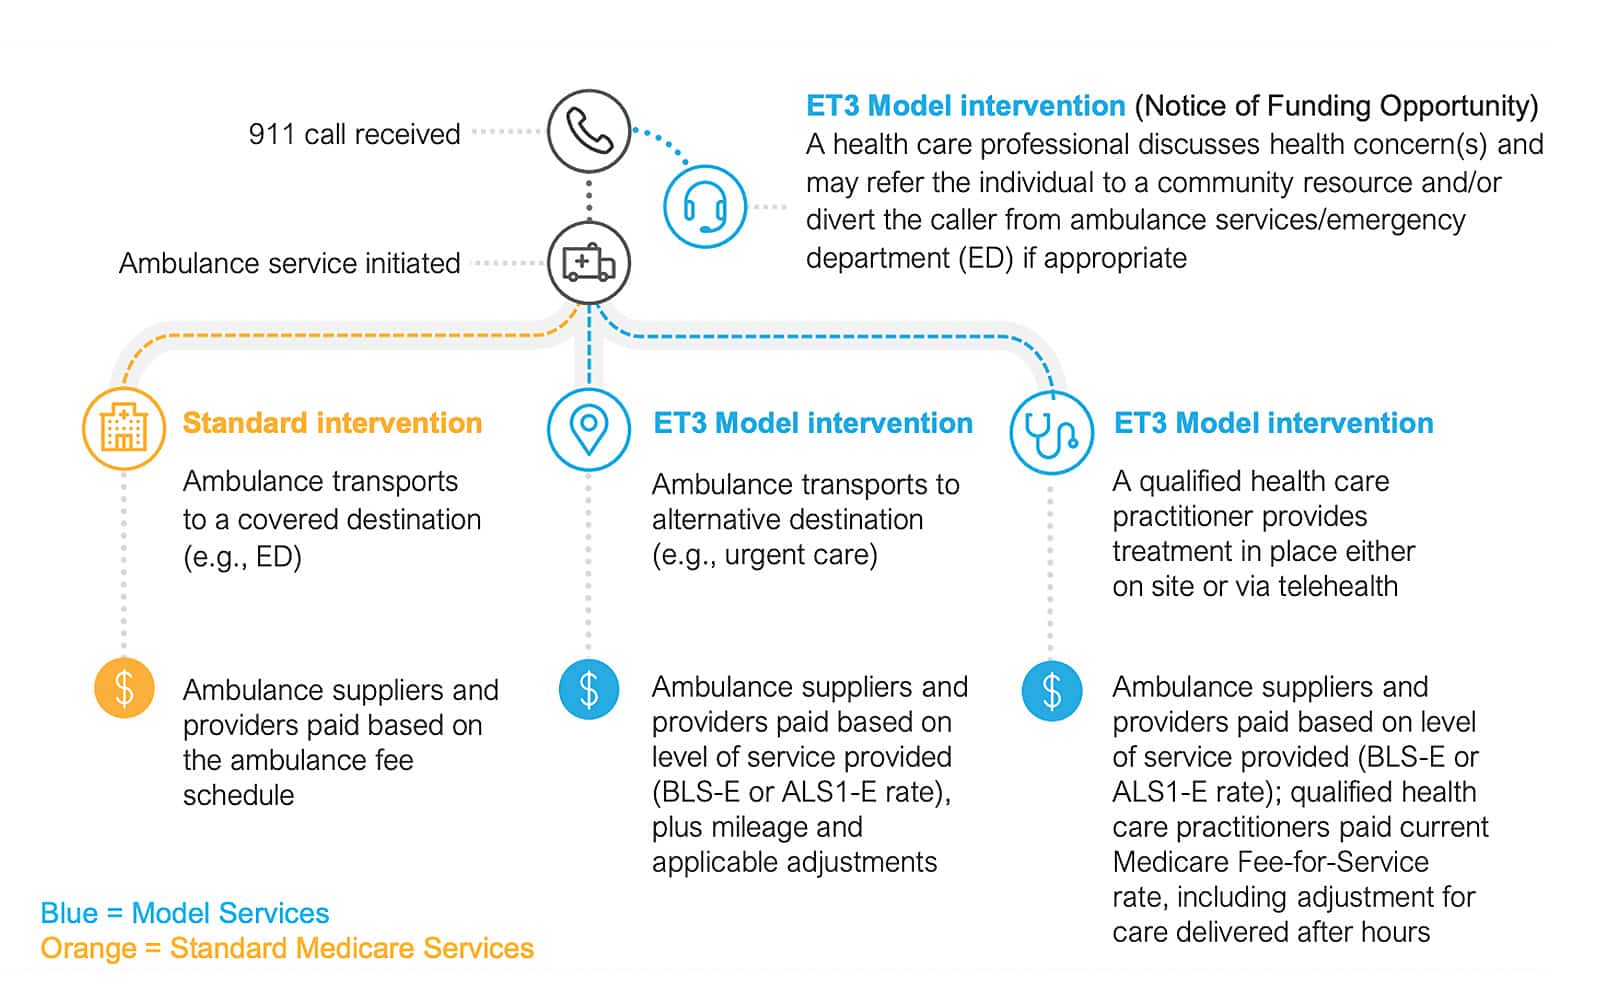
Figure 1: This graphic from the CMS ET3 website shows how the ET3 program allows more channels of patient care through treatment in place or transport to more appropriate, and cheaper, care settings.
Quantifying Regional Differences in Ambulance Sourced ED Visits – How to Use the Dashboard
Using our access to the 100% Medicare Fee-for-Service dataset, we developed a free dashboard to calculate avoidable ED rates for counties across the country. To be able to estimate the ED episodes that may have been avoided through an ET3-like program, we applied the NYU Avoidable ED logic on 2019 Medicare FFS claims. This avoidable ED logic, which we have coded and integrated throughout our products, uses the diagnosis codes on the claim to determine the likelihood that the case falls into different avoidable classifications, based on a thorough review of 6,000 ED claims by a panel of experts. Out of the avoidable classifications listed in the methodology, we combined the (1) Non-Emergent and (2) Emergent/Primary Care Treatable categories into those ED visits that would potentially be applicable to an ET3-like program, where these patients would receive care in place or in an alternative location such as a doctor’s office. The Emergent – ED Care Needed – Preventable/Avoidable bucket, although often considered an avoidable classification, was not used in this analysis, as these episodes would still require transport to the ED.
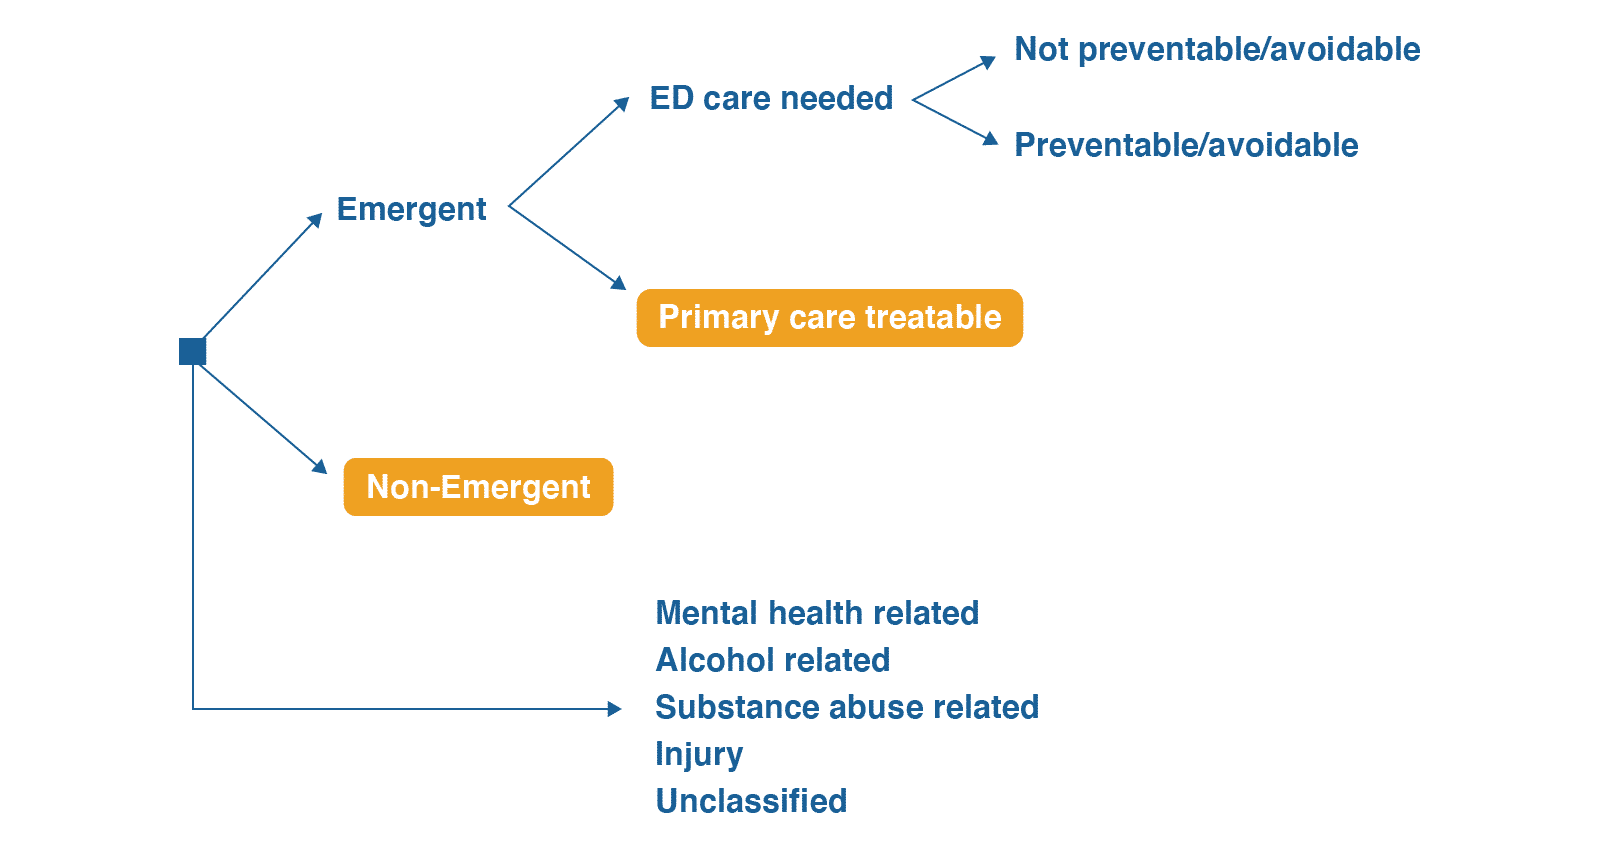
Using the ED classification diagram from NYU, this analysis looked at Emergent – Primary Care Treatable and Non-Emergent classifications. An example of a “non-emergent” diagnosis is L559 – Sunburn. An example of a Emergent – Primary Care Treatable diagnosis is R12, Heartburn.
See a county-level breakdown of avoidable ED rates across the country!
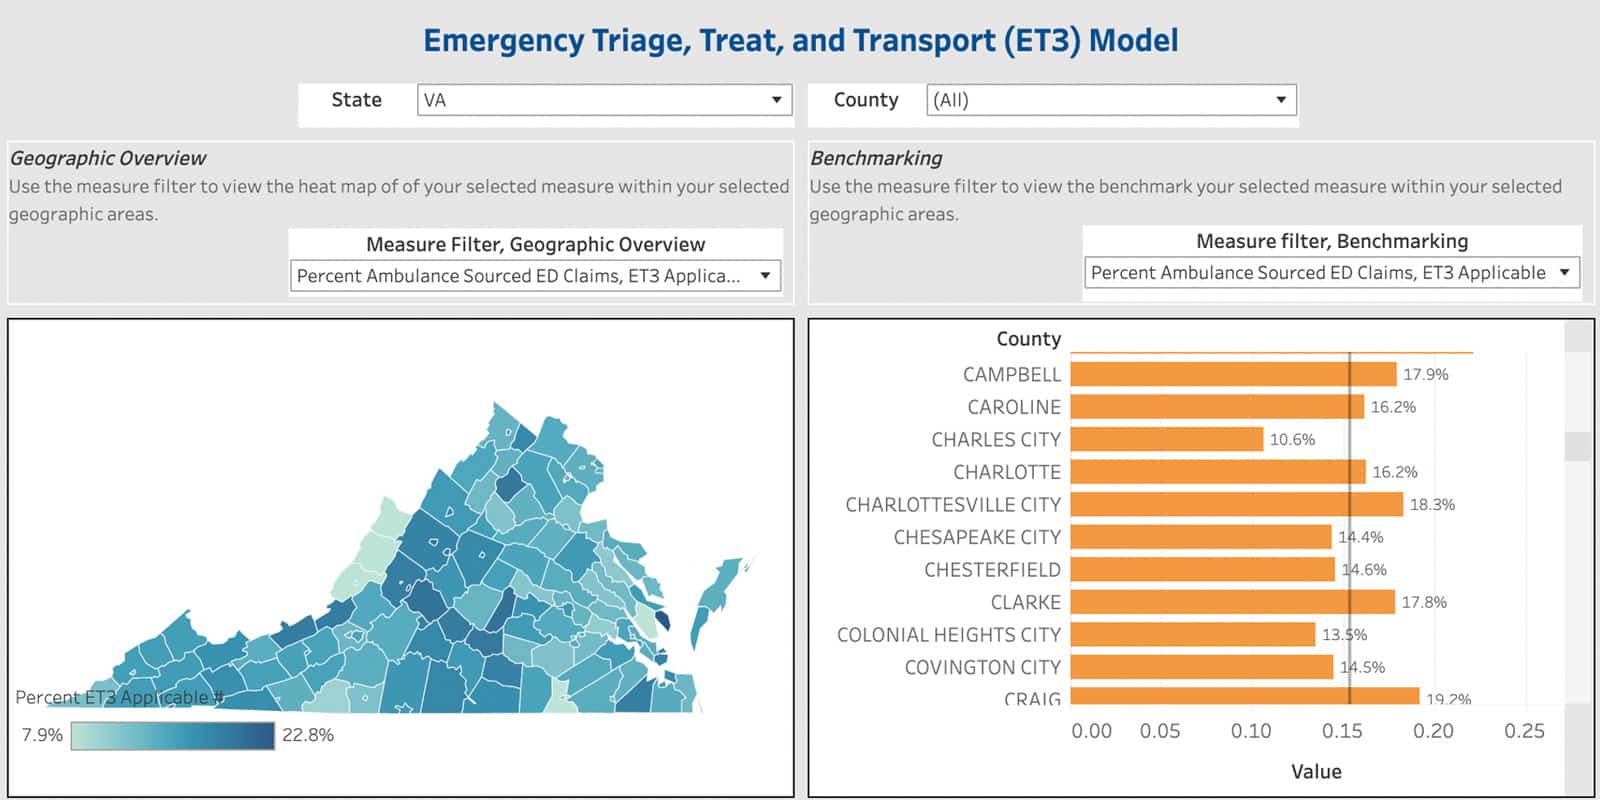
Once the dashboard is accessed, a state can be chosen using the filter on the top of the dashboard. Once selected, a state map will appear with a heat map based on the metric chosen to allow the user to visually identify differences in the ambulance-sourced ED claims that fall into the category selected. The right-side dashboard allows the user to compare the selected measure at the county level with other county and state benchmarks. The metrics that can be selected include total claim counts, total payments, as well as percentages of claims in the avoidable ED classifications listed above. These different metrics will allow for comparison from a volume level, as well as a prevalence level, depending on the goal of the user.
Highlighting Key Uses Cases Using Regional Avoidable ED (ET3 Applicable) Rates
The following use cases give examples of how users can find value from this analysis.
Use Case 1: I am a Director for Managed Care and am responsible for assessing and determining potential new payment models for my organization.
While the 2021 performance year for the ET3 program has just started, for those organizations either already participating or looking to participate in an upcoming cycle, this data can identify which counties are good candidates for the ET3 intervention.
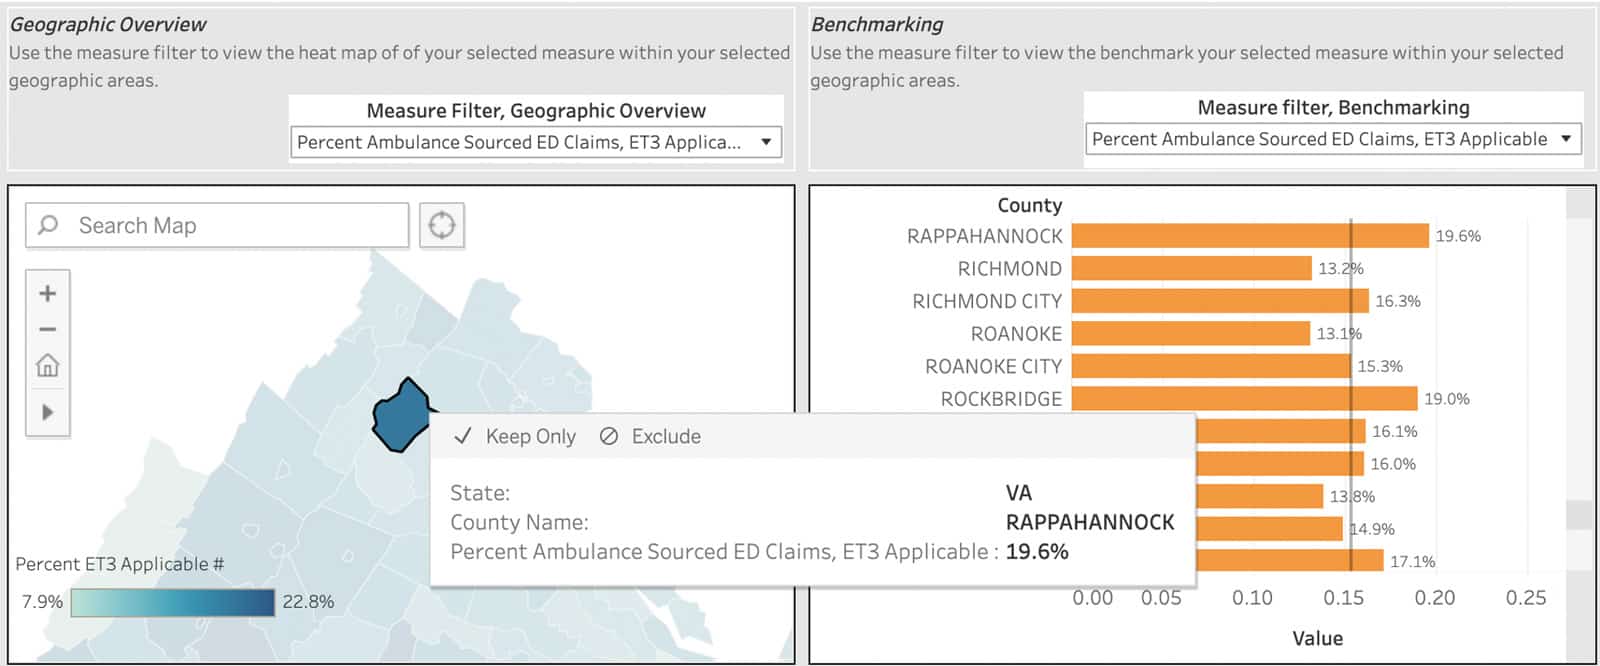
Let’s take an example in the Northern Virginia area. If a health system has coverage across multiple counties in Northern Virginia, we can use this dashboard to determine which counties may be the best candidate for an ambulance program (whether that be ET3 or a similar program). As seen in the screenshot below, in Rappahannock County, 19.6% of ambulance-sourced ED visits were either non-emergent or primary care treatable, much higher than the 14.5% benchmark. However, due to the population size of this county relative to others, this comes out to a total preventable spend of $47k. Fairfax County on the other hand, is below the state average coming in at 14.0%, but with the higher population, amounts to $1.17 million in potentially avoidable ambulance-sourced ED spend. Both the prevalence of ambulance-sourced avoidable ED visits and the total volume of ED visits are important to making the decisions of which coverage areas to implement a program like ET3.
Use Case 2: I am a care improvement analyst and want to find areas of high care variation and savings opportunities for my organization.
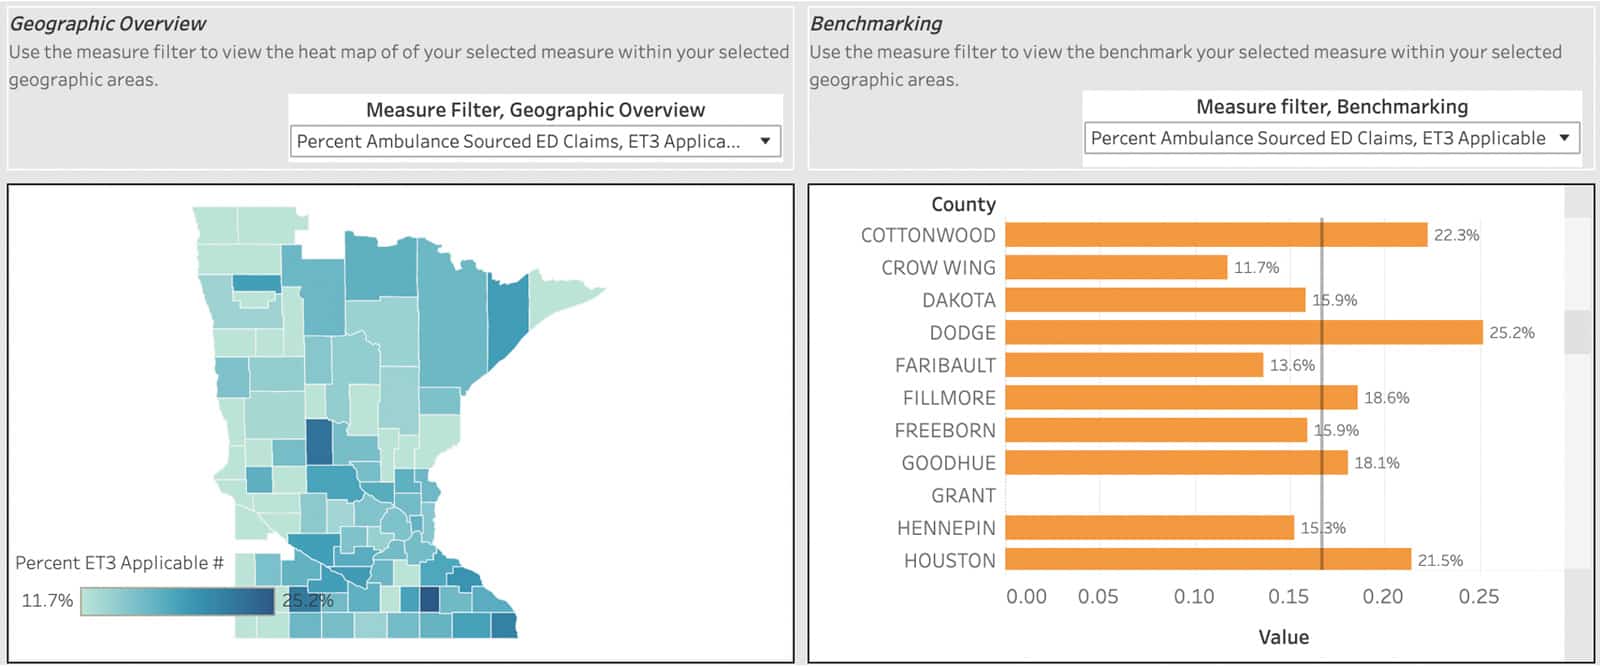
For health systems not involved in the ET3 program, this data can still be valuable in assessing care gaps. Let’s look at a health system in Southeast Minnesota. We can see that Dodge County has one of the highest rates of ambulance-sourced ED visits that are non-emergent or primary care treatable at 25.2%, relative to the state average of 16.7%.
We can also correlate this high rate to other nationally recognized social indexes. For example, the Social Vulnerability Index published by the CDC looks at factors that impact a region’s ability to react to a disaster taking into account factors like lack of access to transportation and poverty. If we look at the Social Vulnerability Index for Dodge County, we see the county scores a .8909, indicating a high level of vulnerability. Could a lack of access to transportation correlate with higher avoidable ED rates indicating an access issue to primary care? Short answer is yes looking at the plot below – CareJourney has conducted this correlation for this, and other social determinants of health (SDOH) measures in a recent blog so make sure to check that out here.
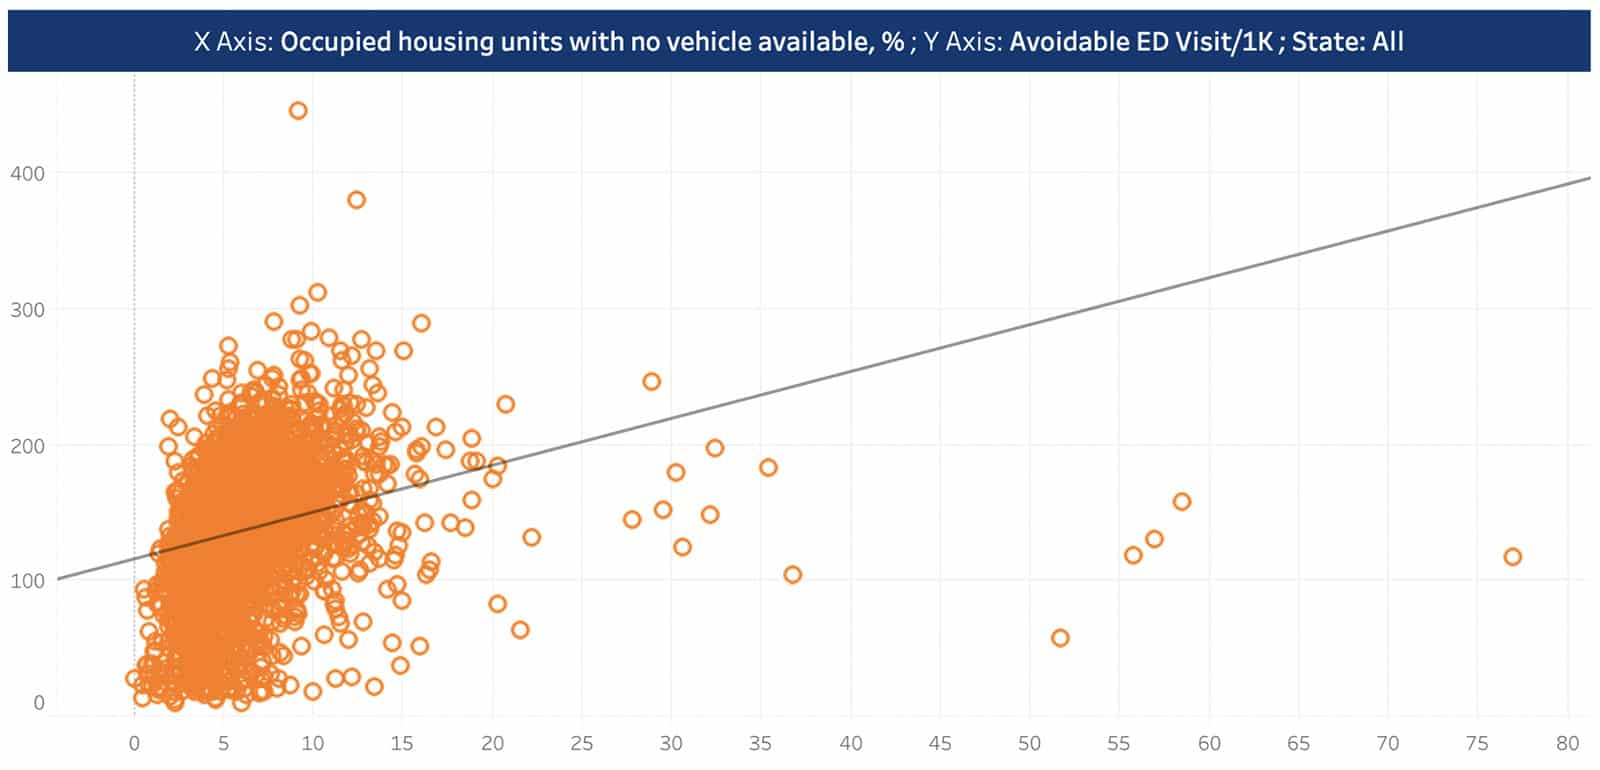
We can see a positive correlation between transportation access and avoidable ED rates. Check out this and other correlations on our SDOH blog here.
This county breakdown of avoidable ED prevalence allows for prioritization in terms of care initiatives to help lower this rate, leading to follow up questions like:
- Do we have the resources and local support to implement an ET3-like program across populations and payers to help with treatment of lower acuity patients in place or at lower cost settings?
- Do we have an adequate number of PCPs in Dodge County?
- How are the PCPs in Dodge County performing relative to their peers in the region?
- What are the most common ED diagnoses that fall into the non-emergent and primary care treatable bucket? Can we implement patient awareness campaigns to help drive care to lower acute settings?
Use Case 3: I am a health information fiduciary responsible for ensuring a Medicare beneficiary gets the best possible care. For patients like the Medicare beneficiary I care for in our neighborhood, what is the likelihood of avoidable ED visits that can be cared for by my local ambulance company if they participated in ET3?
For providers caring for a patient in their office, it’s useful to understand how the region (in this case county) compares with other neighboring regions and state averages. If a provider’s county has a higher prevalence of ambulance-sourced avoidable ED visits, it is important to know this context when meeting with a patient. Using apps with this information at the point of care to get a “year in review” for a patient can help the provider review past ED utilization for a patient. Does the patient have a history of avoidable ED visits? Does the patient have conditions or impacted by social factors that could lead to avoidable ED visits in the future? From these questions, providers are able to use a patient’s history and supplement it with regional benchmarks to ensure their patients receive the care and education necessary to prevent avoidable ED visits in the future.
Explore with CareJourney
As the exploration questions in the previous section imply, this county-level analysis can really help drive further investigation into causes of higher-than-benchmark ambulance-sourced ED visits that are non-emergent or primary care treatable. With CareJourney and our access to 100% Medicare fee-for-service data and other data sets including commercial data, we have the ability to take this context and drive actionable next steps. Working with CareJourney, members can:
- Leverage the Provider Performance Index to see how their PCPs perform relative to their peers in high avoidable ED counties
- Identify providers with the highest number of attributed patients with avoidable ED visits to determine the most impactful interventions to lower avoidable ED utilization and costs
- Identify the top ambulance providers in a given region to identify “key players” in an ET3-like program
- Generate a list of patients with high avoidable ED utilization and their PCPs, to help establish proper care coordination and action plans to help reduce future avoidable ED episodes
If you are interested in understanding how CareJourney’s analytics can help with your organization’s assessment of avoidable utilization, we want to hear from you! If you are currently a member, please reach out to your Member Services analyst for more information. If you’re not a CareJourney member, email us at jumpstart@carejourney.com, or you can learn more by requesting a meeting below.
See a county-level breakdown of avoidable ED rates across the country!
