
Opioid Epidemic, Part 1: The Prevalence of Opioid Use Disorder and Impact of Distressed Communities
By: Zach Bredl and Cody Elias
November 26, 2019
The Growing Opioid Epidemic
The opioid epidemic is a serious public health crisis that is affecting the nation’s social and economic welfare. In 2017, opioids were responsible for about 130 deaths per day, more than 47,000 yearly.1 Opioid prescribing rates are three times higher than they were in 1999 while opioid overdoses are an astounding five times higher. How did this happen? In the late 1990s doctors became increasingly aware of the burden of chronic pain and providers began to increasingly prescribe opioids in order to treat chronic pain. Couple this with the general increasing prevalence of chronic pain and you end up with more than 17% of Americans having at least one opioid prescription filled in 2017. According to an October 2019 report from The Society of Actuaries and Milliman, the overall cost of the opioid epidemic was $179.4 billion – a 128% increase in overall cost over 6 years.2
What Does the Data Show?
CareJourney was founded on the premise that data and analytics are central to achieving the proverbial triple aim of value-based care: a better patient experience, better outcomes, and lower costs. At CareJourney, we specialize in utilizing claims data along with other open data and methodologies to show actionable insights.
Let’s take a look at what medicare claims show us about opioid abuse in part 1 of our 2-part blog series.
CareJourney’s Interactive Dashboard on Opioid Use Disorder Prevalence
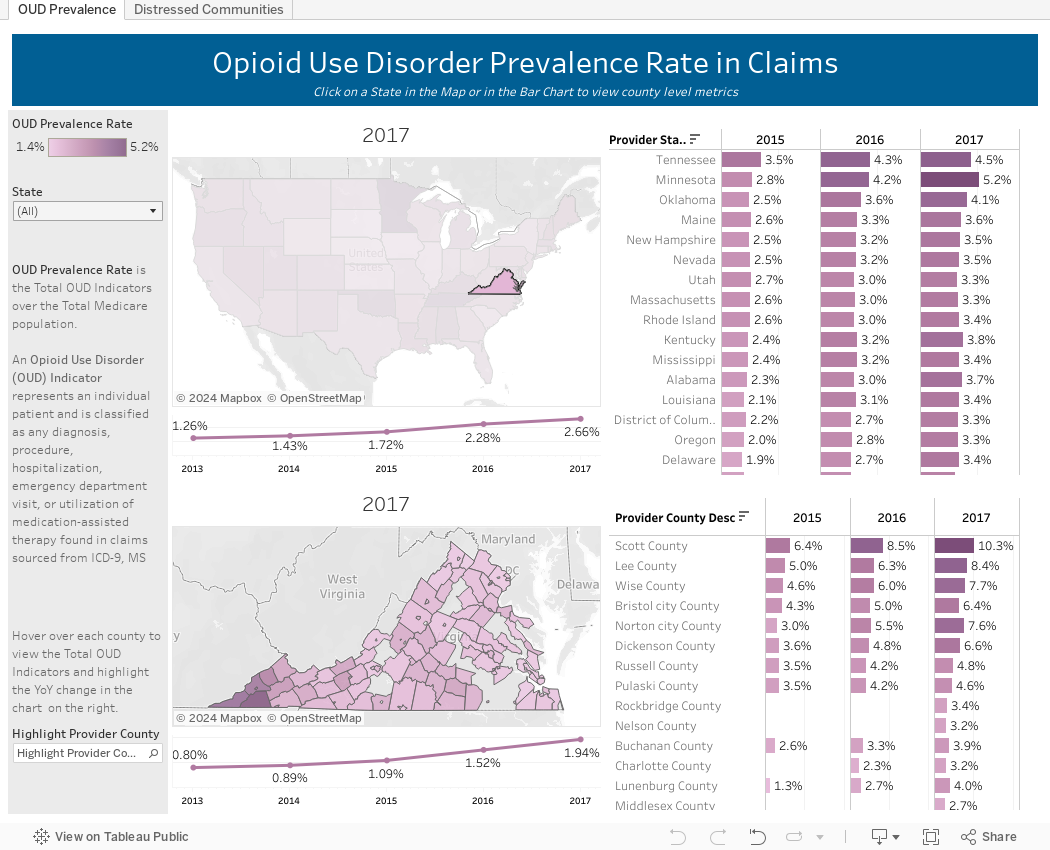
Use CareJourney’s Interactive Dashboard below to explore Opioid Use Disorder (OUD) prevalence rates by State and County over time in the Medicare population. For this analysis, CareJourney utilized the CMS Virtual Research Data Center (VRDC) through the Innovator License program. This dataset allows us to access 100% of Medicare claims and link beneficiaries across all parts to create a longitudinal view of their care. In this blog, we explore prevalence by geography, as well as how prevalence is affected by certain socio-economic factors. Combining the output from the claims data with publically available economic data allows us to tell a remarkable story.
Note: An Opioid Use Disorder (OUD) Indicator represents an individual patient and is classified as any diagnosis, procedure, hospitalization, emergency department visit, or utilization of medication-assisted therapy found in claims sourced from ICD-9, MS DRG, or HCPCS Codes.
Key Findings:
- Prevalence has doubled across the board
Across the country in Medicare claims, the Opioid Use Disorder3 (OUD) Prevalence Rate, or the total OUD Indicators over the Total Medicare population, increased more than 2x from 1.26 diagnoses per 100 beneficiaries to 2.66 diagnoses per 100 beneficiaries from 2013 to 2017. - OUD Prevalence Rates consistently on the rise, but significantly higher in some states
Using the dashboard’s filters and click functionality, we can identify states that had varying OUD Prevalence and explore their rates over time. Wholistically at the state level, every state’s OUD Prevalence Rate continued to increase from 2015 to 2017, however, the OUD Prevalence Rate increases range from more than 2 diagnoses per 100 beneficiaries in states such as Minnesota to less than a 1 diagnosis per 100 beneficiaries in states such as Iowa, Nebraska, and South Dakota. - Variation is stark even at the county level
Taking the analysis one step further, the dashboard allows users to explore within states to see the OUD Prevalence Rate variation at the county level. For example, looking at Georgia, we can identify counties such as Hall County and Douglas County that have decreased their OUD Prevalence Rate from 2016 to 2017. We can also identify counties like Baltimore City County in Maryland that shows an astounding OUD Rate of 7.1% – over double the state average. - On the bright side, OUD increase fell year over year in 2017
At the state level, total diagnoses of OUD have increased every year in every state from 2015 to 2017, including a staggering 33% increase in 2016 alone. However, the rate of OUD increase year over year fell in 2017, only increasing by 16%, possibly showing that things are moving in the right direction. Tennessee (4%), Mississippi (6%), Utah (9%), and Maine (9%) led the pack with the least increase of OUD diagnoses in 2017.This change in year over year increase could be related to the increased education against opioid abuse, media coverage of the epidemic in general, as well as medication treatment for OUD.4 Though prevalence of OUD had already been steadily increasing for years, the frequency of mentions of treatment for OUD in the news did not show a substantial increase until 2015.
Correlating Opioid Use Disorder and Distress Index
Connecting claims data to open data is in CareJourney’s DNA. On the second page of the Interactive Dashboard, we explore combining Economic Innovation Group’s Distressed Communities Index (DCI) with OUD claims. The DCI combines several complementary metrics into a single measure of economic well-being called the Distress Index (Index=5 being the most distressed). The index is calculated by geography and sorted into quintiles based index performance: Prosperous, comfortable, mid-tier, at risk, and distressed.
It is often hypothesized that areas with more socio-economic struggles are more likely to have opioid abuse issues – so let’s dive into this with some real data. In 2017, CareJourney data analysis shows that Minnesota has the highest OUD rate at 5.2% while having the 5th lowest Distress Index. However, the next 4 highest OUD rates (Tennessee, Oklahoma, Kentucky, and Alabama) all have DCIs above 60, putting them in the top quintile. Getting more granular to the county level – counties with a distress index of 4 or 5 have 50% more diagnoses of OUD per 100 patients than counties with a distress index of 1. Using the above dashboard you can further dive into county-level detail. Are the states with the highest OUD prevalence heavily affected by a few outlier counties or is there little correlation between distress score and OUD prevalence?
Medicare Efforts to Combat the Opioid Crisis
CMS has recently introduced new Medicare Part D patient safety policies with the goal of combating the opioid epidemic.5 Policies involve adding new safety alerts upon triggers such as a beneficiary receiving prescriptions that exceed a certain amount or having prescriptions called into multiple pharmacies. In certain situations, beneficiaries will be limited to a 7-day supply if they have not recently been prescribed opioids. The policies also opens up the structure to implement various drug management programs which will force patients being prescribed opioids from multiple doctors to have one specific provider review and coordinate their care. Lastly, CMS has put together a plan to better promote treatment for patients already diagnosed with OUD, especially treat with non-opioid drugs. CMS is exploring incentivizing usage of non-opioid drugs for pain management and OUD treatment with separate payments through Outpatient Prospective Payment System and Ambulatory Surgical Center Payment System. These policies are part of an ongoing effort that CMS announced in 2018 to combat the opioid epidemic. Policies are expected to be continually updated and adjusted based on the effectiveness of the solutions.
Next Step: Understanding Incidence, Prevalence, Cost of Care, and Comorbidities of Target Populations
CareJourney recently developed a new tool – Cohort Atlas, that allows our customers to customize cohort definitions to understand incidence, prevalence, cost of care, comorbidities and more, of target populations. Our customers use Cohort Atlas to analyze the journey OUD patients take before and after their diagnosis.
- What other health issues burden these patients?
- What procedures or drugs are common in the year prior to diagnosis?
- What physicians are frequently prescribing to these patients?
Feel free to email us at info@carejourney.com or request a demo below!
Build and Optimize Networks of Care with Network Advantage
REQUEST A DEMO
In addition, our Network Advantage platform allows members to explore OUD by both attributed and rendering providers. This data can be leveraged to determine which providers commonly manage and treat patients with OUD, or any other chronic condition.
Follow-up Blog on Opioid Prescription Rates Across the Country, Coming Soon!
In the next CareJourney blog on the opioid epidemic, we’ll take a look at opioid prescription rates across the country and identify regions in which providers have increased or decreased their prescription rate. Stay tuned for our follow-up blog that will look at opioid prescribing patterns at the provider level!
- https://www.npr.org/sections/health-shots/2019/10/24/773148861/calculating-the-real-costs-of-the-opioid-epidemic
- CMS defines Opioid Use Disorder as one of the conditions in their “Other Chronic Health, Mental health, and Potentially Disabling Conditions” category. The methodology can he found here: https://www2.ccwdata.org/web/guest/condition-categories.
- https://www.healthaffairs.org/doi/abs/10.1377/hlthaff.2018.05075
- https://healthpayerintelligence.com/news/cms-new-medicare-part-d-policies-to-address-opioid-epidemic