Navigate the Complexities of ACO Strategy with Data-driven Insights
By Maryanne Kiley and Blair Mohney
April 18, 2024
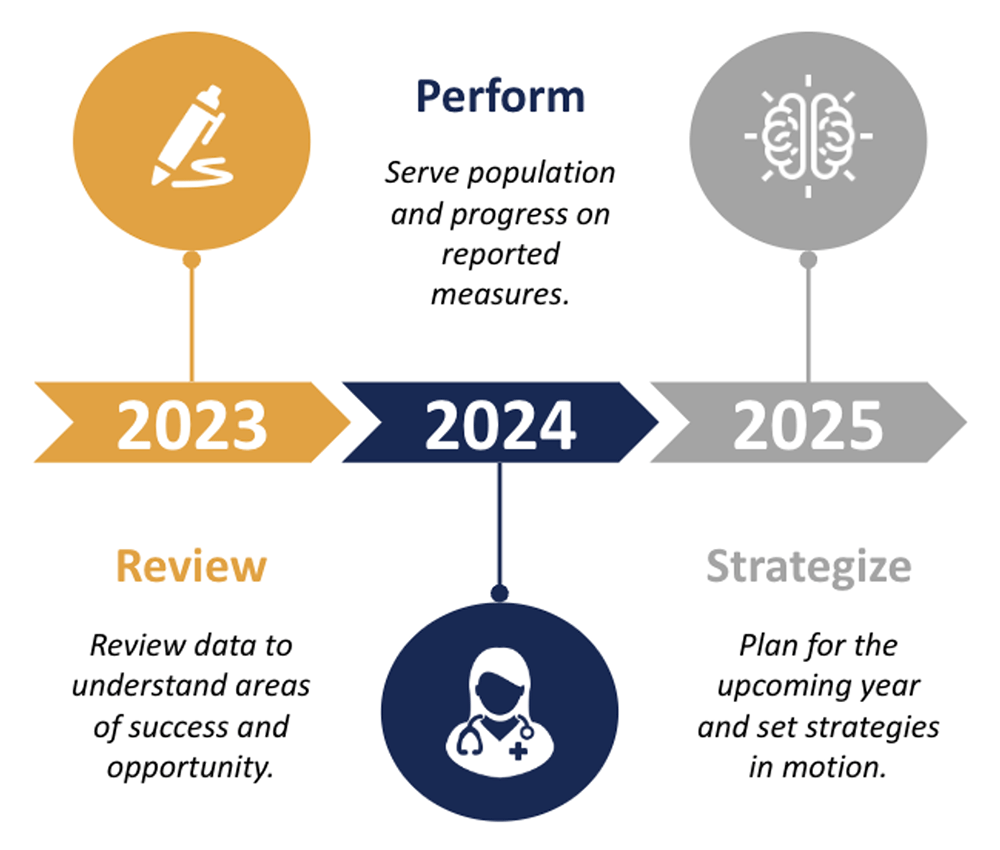
Accountable Care Organization (ACO) leaders are currently in the midst of a balancing act—navigating the past, present, and future.
They are simultaneously understanding their Performance Year (PY) 2023 performance, executing on their PY 2024 clinical strategy, as well as planning budgets, renewals, and strategies for PY 2025. With application deadlines, roster changes, and other decisions that impact PY 2025 looming, ACO leaders need to start planning for next year—without even fully understanding PY 2023 performance.

Having the right data and analytics is crucial to balancing these responsibilities successfully. In the rest of the blog, we will consider how to apply data across 4 key scenarios ACO leaders are currently grappling with in this balancing act.
These include:
Managing a Population
The biggest top-of-mind scenario for ACO leaders today is managing their PY 2024 population.
ACOs that manage their population successfully focus on impactful, as well as impactable, ways to improve patient care, and their alternative payment model (APM) performance. Specifically, these organizations:
- Maintain strong alignment of their population.
- Accurately capture population conditions and then assign care management resources.
- Identify patients most in need of an intervention and ensure high value specialist care.
- Prevent downstream avoidable or excess spend and incidents.
In managing an existing population, the sooner leaders identify a trend in the data, the more likely they are able to intervene. ACO leaders need the most timely data on their patients at the right time. While admission-discharge-transfer (ADT) feeds and claim and claim line files (CCLFs) are useful in some cases, clinical interventions or follow up care can be outdated and a waste of limited resources. Often, these sources reflect patient activity that is up to three months old or an incomplete picture.
Instead, organizations should use the Beneficiary Claims Data API (BCDA), offering a 6-8 week advantage over CCLF files. In leveraging this timely data, leaders accurately track impactful metrics or care gaps.
For analytically advanced organizations, this data could inform a prediction model uncovering, for example, patients most at risk of an ED visit in the next 90 days. Or the data could identify patients most at-risk to develop a certain condition based on other pre-existing conditions.
On a basic level, this data could identify actionable patient segments, like frailty segmentation–highlighting likely rising risk and cost. Clinical teams can track these patients that move into high-risk categories in the past 30 days–establishing a small, actionable cohort to prioritize. Subsequently, a chronic care management program can enable close, intentional follow up with this group.
Taking it a step further, organizations can even ingest this data into their EHR or population health tool, ensuring seamless actionability on this data.
In any flavor, more timely data will lead to impact for PY 2024 populations.

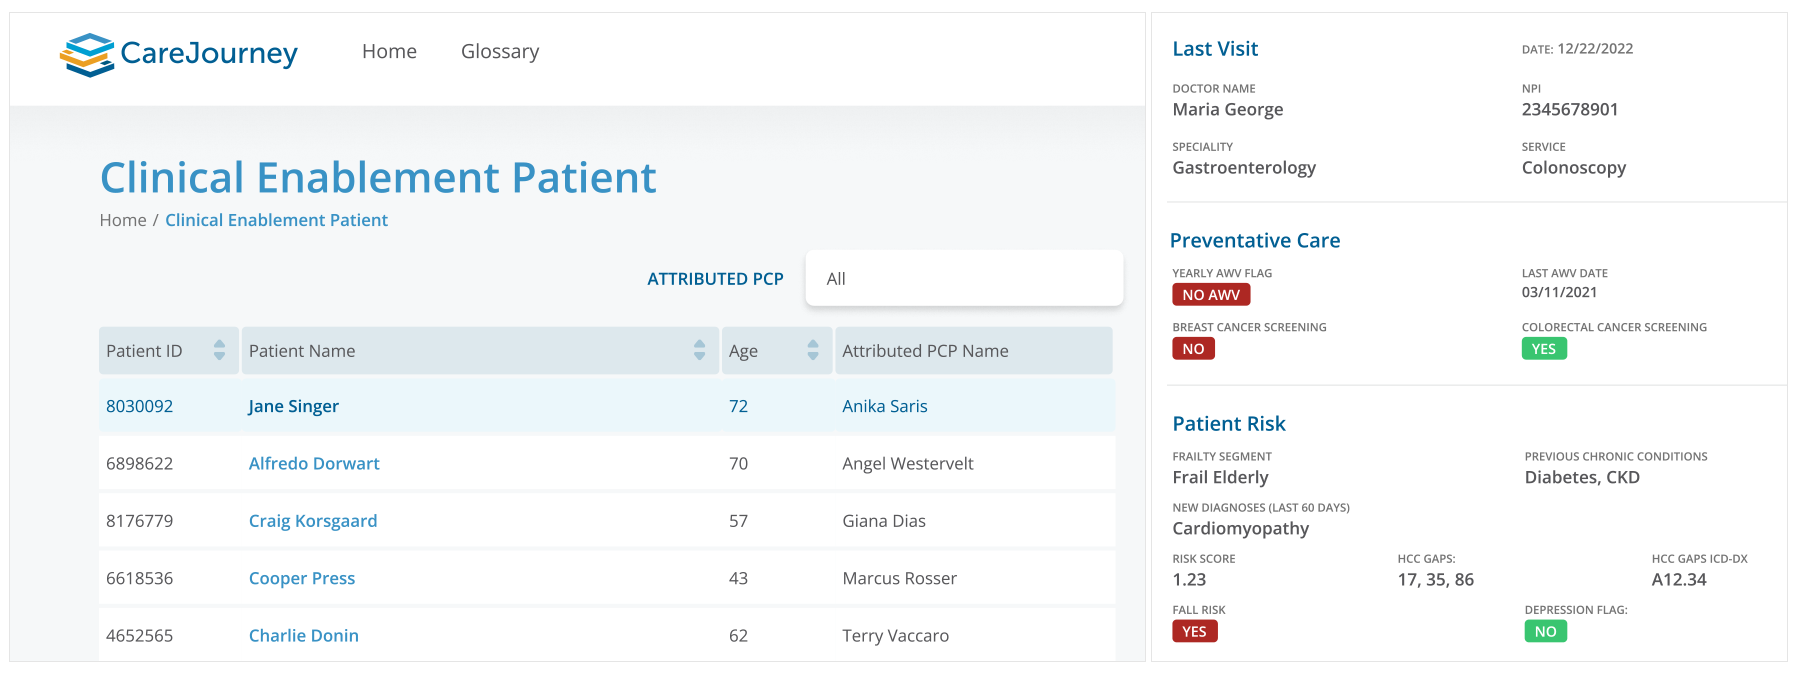
Sample CareJourney patient profile to enable informed and well-timed care management decisions.
Developing a Growth Strategy
A second top-of-mind scenario is PY 2025 planning. These deadlines tend to sneak up and require a lot of analysis and thought.
When considering the year ahead, ACO leaders need to consider: Do they keep participating in the model they’ve been operating in? Do they grow into a new market? What does competition look like in their markets?
This is an area where data is critical for informed decisions. ACOs leverage the data shared from Centers for Medicare and Medicaid Services (CMS) to understand performance dynamics in their own ACOs. However, this data leaves them somewhat blind. Ideally, ACOs need data on inside their four walls, as well as outside their walls. They need data on other markets and their competition. This helps them best position themselves for the year.
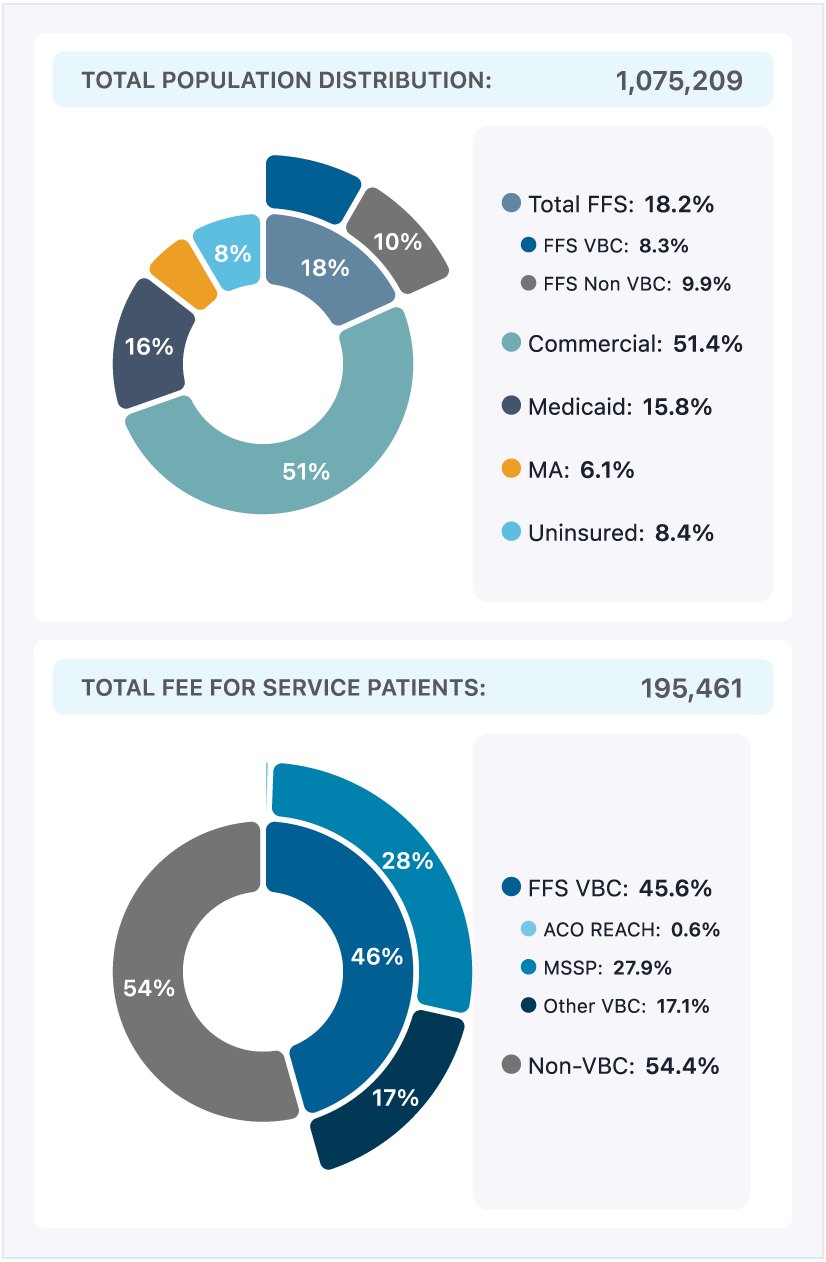
Comprehensive market intelligence data identifies opportunities in new markets, for example. In the sample market below, there is a relatively low Medicare Advantage (MA) penetration, only 6.1%, and a fair amount of patients in original Medicare, but not a value-based care arrangement (9.9%). This presents an opportunity with a substantial number of patients who could be enrolled in a value-based care (VBC) program quickly through an ACO expanding into this market.

Sample CareJourney market level summary, eliminating blind spots.
Alternatively, market data might reveal a highly penetrated value-based care population. In that case, the market may represent an area of expertise lacking for an ACO and an opportunity to reach out to experienced groups.
Either way, creating a PY 2025 growth strategy with this comprehensive market intelligence limits unknowns and drives strong decision making.
Enhancing a Roster
A third common scenario for ACOs right now is PY 2025 roster planning. They are considering who to include on their roster, and starting to have recruiting conversations, prompting questions like: How many patients does a group bring? How will they impact the benchmark? How will they manage patients?
For this scenario, modeled historical performance gives the best indication of future performance. Without profiling different practices and providers against modeled program performance (whether they were previously in a VBC arrangement or not), ACO leaders risk selecting the wrong partners and finding out at the end of the year. Informed ACOs enter into these recruiting conversations knowing the provider group’s modeled benchmark and corresponding performance. They have pre-identified candidates aligned to their strategy and discuss how a partnership benefits both the group, as well as the ACO.
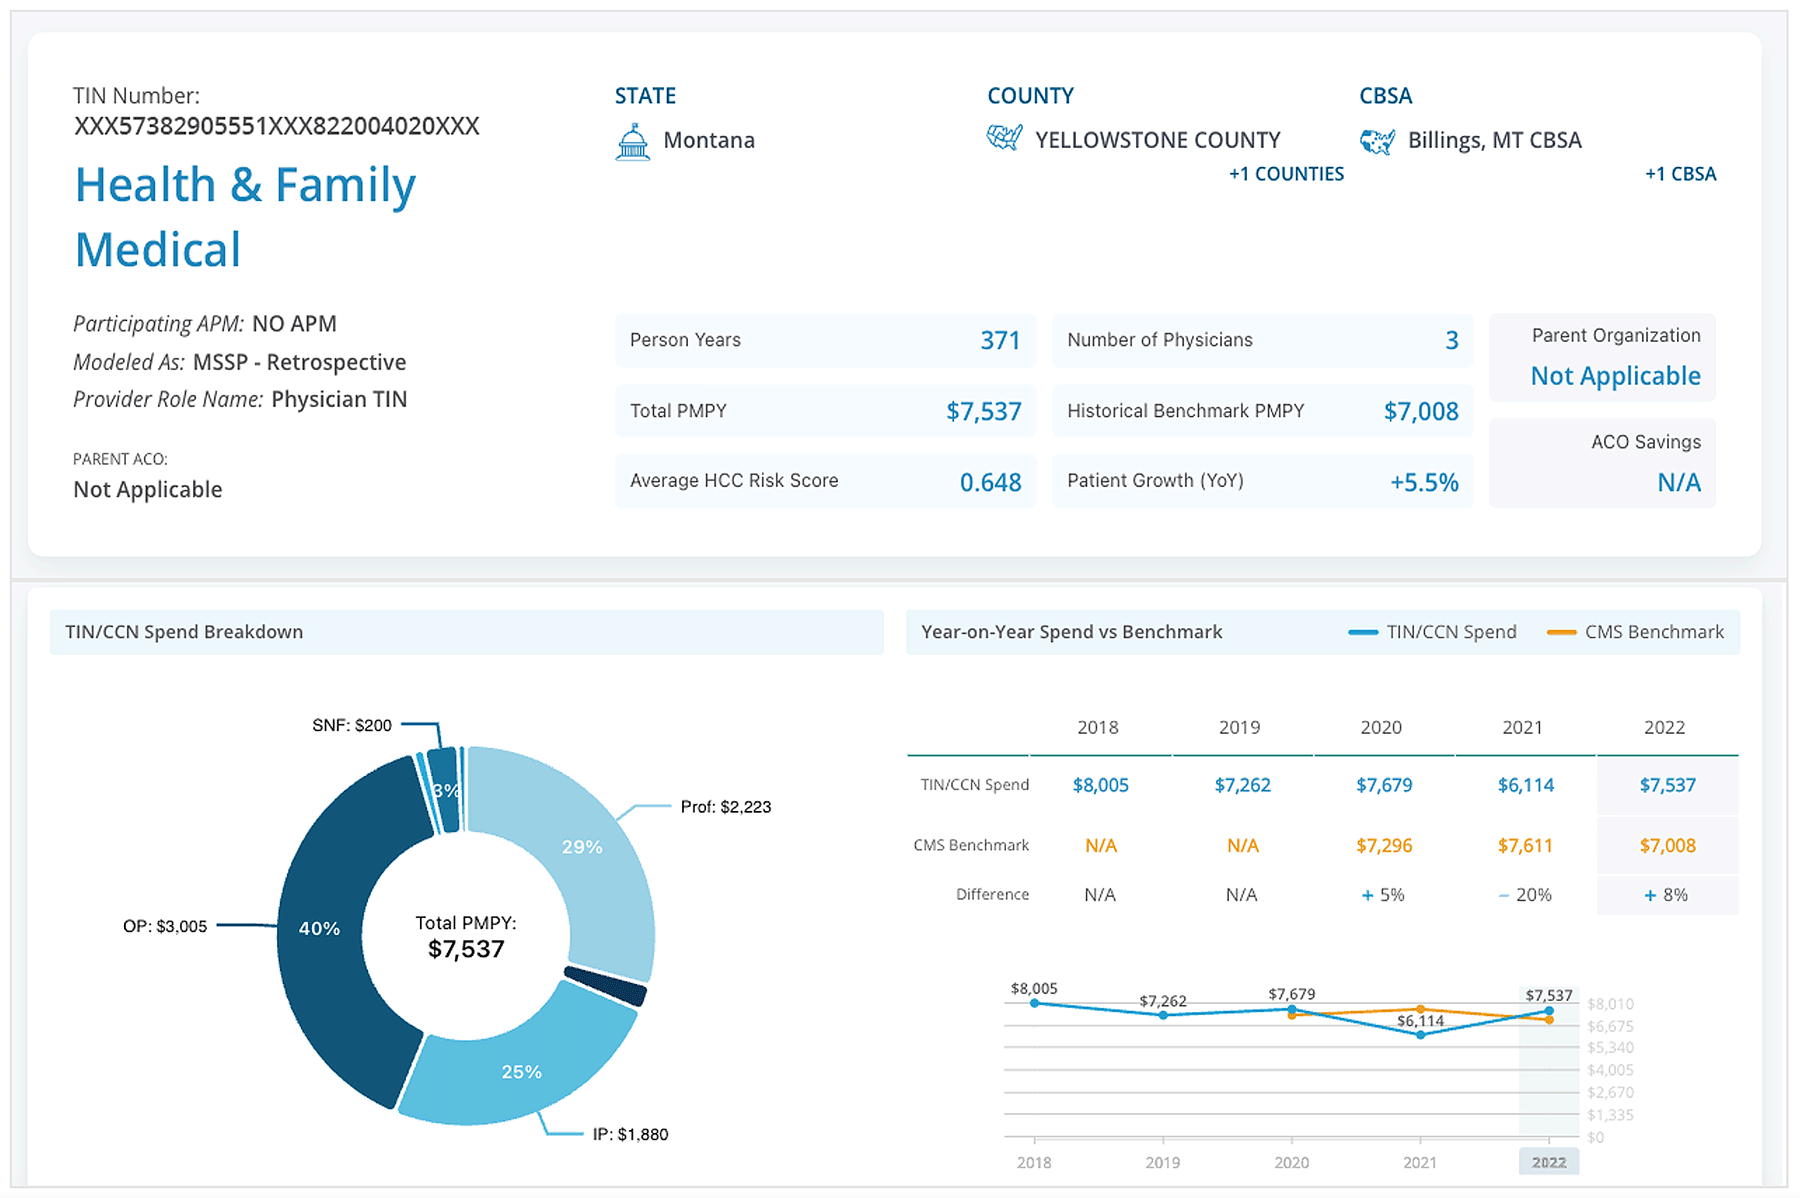
The example below shows performance metrics for a practice group not involved in an ACO. However, retrospectively modeled performance in MSSP highlights a historical benchmark of $7,008 per member per year (PMPY), and an actual performance of $7,500 PMPY (over benchmark). Had this group been in an ACO’s network, they wouldn’t have helped achieve savings. However, maybe the group has a significant population of frail elderly patients, which the ACO knows how to serve quite well – showing this group has synergy and is a strong candidate to join their roster.

Sample CareJourney group profile to model out anticipated performance within a VBC arrangement.
Improving Specialty Care Performance
A final top-of-mind scenario for an ACO is managing the specialist team serving their patients, as well as ensuring their population sees high performing specialists.
Specialty care is a large percentage—by some estimates, upwards of 70%—of total cost of care. With that in mind, there are several levers ACO leaders pull to achieve better care and savings when it comes to their specialty service lines.
To excel at these strategies and take action, ACO leaders must first peel back the layers of specialty care data into approachable components—starting with a service line, and then individual episodes. In looking at the data more granularly, ACO leaders identify improvement opportunities in a way that is actionable.
The example below highlights several episodes within the cardiology service line. Specifically, there are 337 patients with an ischemic heart disease episode, about 20% of the total ACO population in this example. With detailed episodic metrics, leaders unearth insight about a specific care journey (one which they can scale or improve upon). The example shows an observed to expected ratio, in this instance an area to improve overall cost, representing an opportunity for the ACO.

Sample CareJourney episodic analytics to highlight specialist performance.
With this granular information, ACO leaders begin routing patients to the right provider for their condition based on the data. For example, ACO leaders would not want to route all of their Ischemic Heart Disease patients to a specialist performing above expected on cost and below expected on specialty-specific quality measures. With granular insights like this, ACO leaders can begin holding specialists accountable for managing their population with the right incentives.
Absent these granular insights, ACO leaders are flying blind with high-level general performance assessments on where to send particular patients for a procedure, or how to coach their specialists.
About CareJourney Data & Analytics
The above examples underscore the impact of data-driven decisions for ACO leaders as they navigate PY 2024 and plan for PY 2025.
A 10-year veteran in value-based care, CareJourney insights guide the strategies and operations of innovative healthcare organizations across the most impactful success drivers.
CareJourney insights help healthcare organizations grow, improve care quality, and reduce costs using the most robust, detailed, comprehensive claims dataset available.
Analytics derived from Medicare, Medicaid, Medicare Advantage and Commercial claims data unlock insights on over 300 million beneficiaries and 2 million providers. With open and transparent methodologies, CareJourney’s 250+ episodes benchmarked make both care decisions and business decisions a no-brainer.

