By Sarah Grace
For organizations across the healthcare sector concerned with network building and management, utilization of the network among the attributed population is often a major area of focus. Whether from a provider or payer perspective, maintaining a high-performing network with high utilization allows organizations to more effectively manage the quality and cost of patient care.
For Accountable Care Organizations (ACOs), maintaining high rates of in-network utilization is a particularly difficult task. By definition, Medicare fee-for-service beneficiaries can seek care wherever they please; additionally, they may not even be aware of the fact that they are part of an ACO. At the same time, ACOs are tasked with, and held responsible for, managing all aspects of their patients’ care. The more these patients go “out of network”, the less ability the ACO has to coordinate care.
Observing the amount of spend going in and out of network for ACOs in the Medicare Shared Savings Program can provide insight and a benchmark for all types of organizations concerned with optimal network design and management.
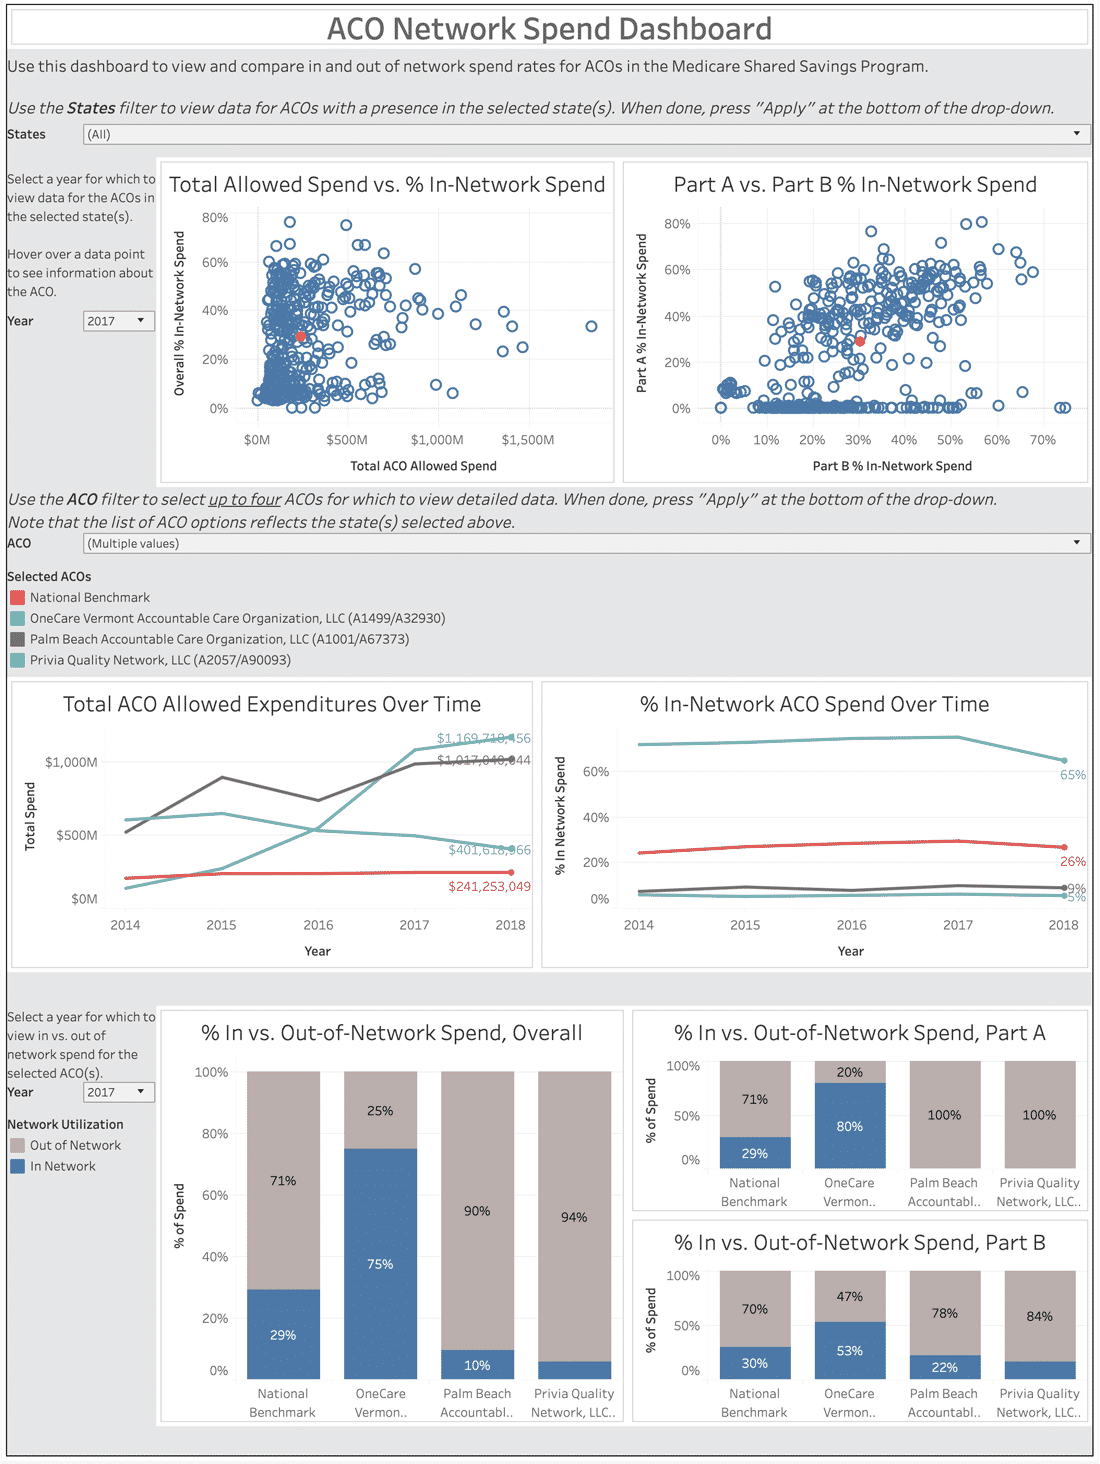
See How Your Organization Compares: An Interactive Dashboard
Fill out the form to the right to view and benchmark ACO in and out-of-network spend rates from 2014-2018.

Get Access
Methodology
For this analysis, we consider all Medicare Part A and B spend for beneficiaries attributed to Medicare Shared Savings Program (MSSP) ACOs between 2014 and 2018. For each provider or facility a beneficiary visited, we reference the ACO rosters to determine whether that provider or facility was in or out of network for the beneficiary. We then calculate the percent of overall spend staying in or leaving the network each year.
Discussion
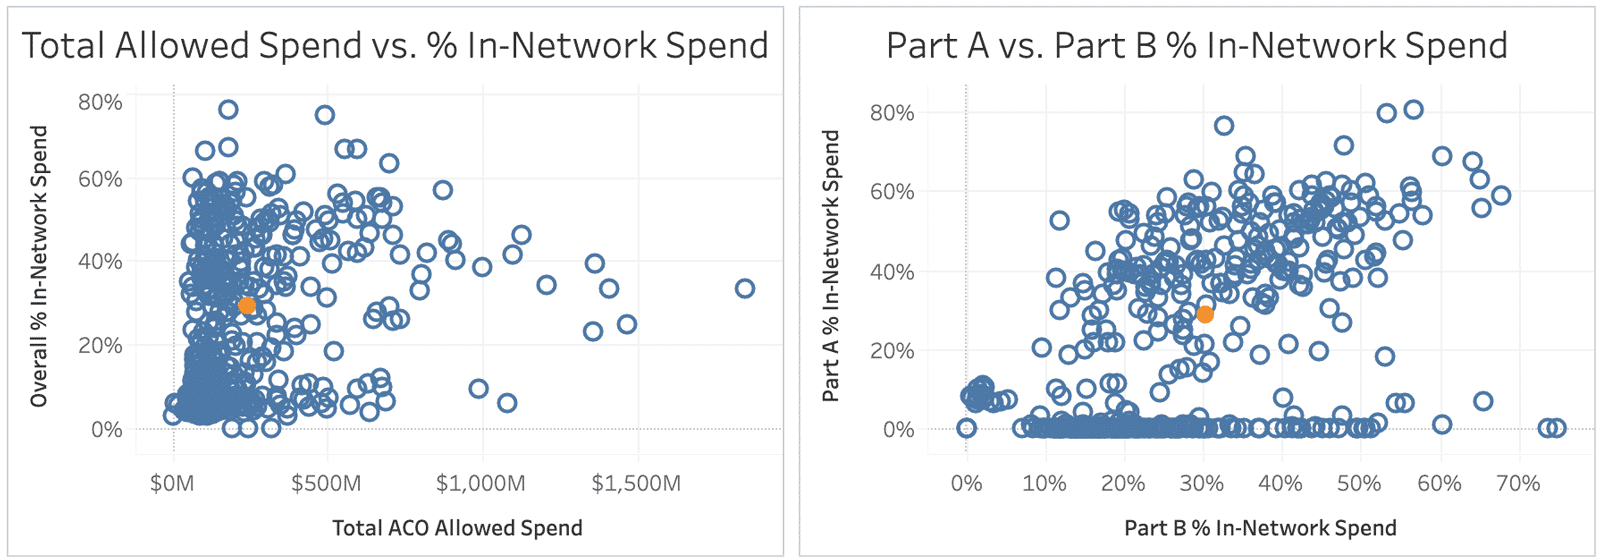
There is wide variation in the percentage of spend that is kept in-network across the ACO cohort, particularly when breaking out spend by Part A and Part B:

Impact on Shared Savings
ACO networks take many different forms, and the relationship between ACO network utilization and shared savings performance remains unclear. One important point of differentiation for future analysis is what out-of-network utilization is avoidable vs. unavoidable.
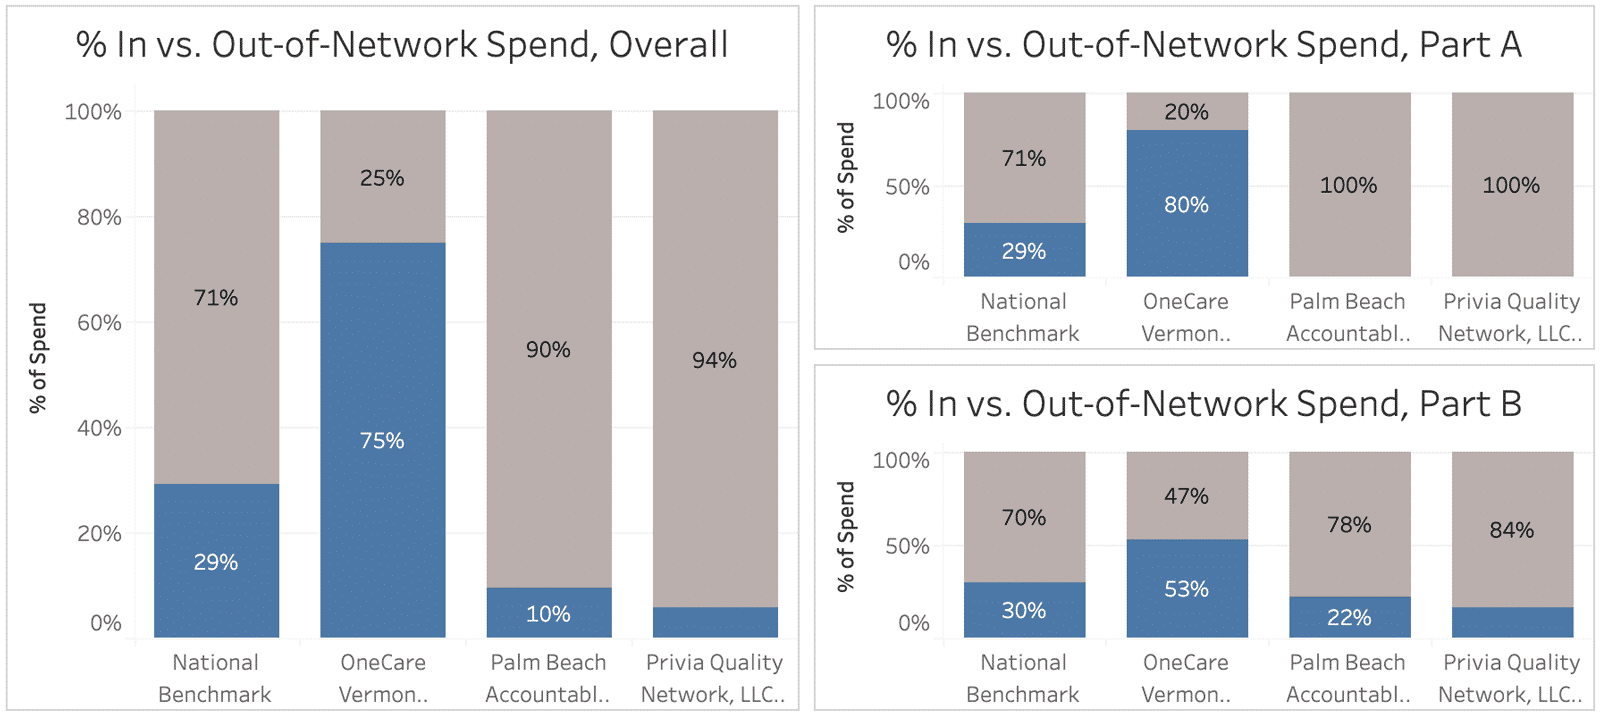
For example, two big winners in the MSSP for 2018 – Palm Beach ACO and Privia Quality Network (both CareJourney Members!) – have relatively low rates of Part B spend staying in-network, and no Part A spend staying in-network. However, looking more deeply, we are able to see that these two ACOs are primary care-oriented, and largely do not have specialists or facilities in their networks. Therefore, while the spend for their patients is going out-of-network, it appears that the in-network PCPs are performing well in terms of patient care management, and referring to high-quality and low-cost entities outside of the ACOs.
Further, it is unclear whether providing a comprehensive network of specialists and keeping patient utilization in-network are vital to effectively and efficiently managing specialty care for an ACO population.1
Network Factors
As displayed on the right in the above chart, there are numerous ACOs that have varying amounts of Part B in-network spend, with no Part A in-network spend – these ACOs are most likely based around collections of primary care practices, like the two aforementioned ACOs. Others have much higher rates of in-network spend, as well as a Part A network – many of these are built from health system networks.
One ACO that appears to have a particularly comprehensive network is the OneCare Vermont ACO (part of the Next Generation program since 2018). In 2017, OneCare Vermont had over 50% of spend stay in-network for most specialties, with 96% of family practice spend going to in-network physicians, and 70%+ of spend staying in-network for many other major specialty areas as well, including orthopedic surgery, cardiology, medical oncology, gastroenterology and urology. The one major specialty area with a lower in-network spend rate (at 32%) was ophthalmology. In terms of Part A spend, OneCare Vermont kept over 90%+ of spend in-network for rural primary care hospitals, renal disease treatment centers, home health agencies, and hospice facilities.

While out-of-network care may be largely driven due to the absence of necessary specialties and facility types in ACO networks, it is possible that other factors could have an impact, such as inconvenience or inaccessibility of provider locations, or poor communication of ACO membership to beneficiaries.
Patient Factors
In addition to the influence of network factors in driving ACO network utilization, patient factors may also have an impact. A 2016 paper in the journal Medical Care focusing on the UCLA ACO assessed the prevalence and predictors of out-of-ACO care among the attributed patient population.2
The study found several patient factors associated with higher rates of out-of-ACO spend, including:
- Race: White beneficiaries spent more outside of the ACO than Black, Asian, or Latino patients; this was largely driven by outpatient office expenditures.
- Age: The youngest group of age-eligible beneficiaries (65-74 years old) had the most out-of-network spend.
- Comorbidities: Having ESRD was a major driving factor in terms of high out-of-ACO spend. Patients with other comorbidities also had higher out-of-network spend than those that did not.
- Insurance: Dual-eligible beneficiaries, as well as beneficiaries with employer-based supplemental insurance, spent less out-of-network than those who had neither.
- Convenience: Patients that lived further from the ACO were more likely to go out of network for care.
Of course, this analysis was for a single ACO – a large, urban, hospital-based one – and these findings may not extend to other types of ACOs per se. Future analysis should consider the interplay between network factors and patient factors in managing network utilization and coordinating patient care.
Explore with CareJourney
If you’re interested in better understanding the drivers of network utilization and the network structure of high-performing ACOs, we want to hear from you! CareJourney can help by looking deeper to utilization rates by spend category, facility type or specialty to assess potential areas for network optimization. Reach out to your member services representative to learn more.
If you’re not a CareJourney member, email us at jumpstart@carejourney.com, or you can learn more by requesting a demo below.
Not a CareJourney member?
Request a demo
- Barnett, M. L., & McWilliams, J. M. (2018). Changes in Specialty Care Use and Leakage in Medicare Accountable Care Organizations. The American Journal of Managed Care, 24(5), 141–149. Retrieved from https://www.ajmc.com/journals/issue/2018/2018-vol24-n5/changes-in-specialty-care-use-and-leakage-in-medicare-accountable-care-organizations
- Han, M. A., Clarke, R., Ettner, S. L., Steers, W. N., Leng, M., & Mangione, C. M. (2016). Predictors of Out-of-ACO Care in the Medicare Shared Savings Program. Medical Care, 54(7), 679–688. doi: 10.1097/mlr.0000000000000541
