By Amanda Forlin
Data Visualization by Cody Elias
The Centers for Medicare and Medicaid Services (CMS) released the 2018 Financial Performance results on all Accountable Care Organizations (ACOs) participating in the Medicare Shared Savings Program (MSSP). CMS shared this data for the last six years, contributing to a more transparent, open evaluation of the program, and demonstrating how ACOs are not only increasing overall savings, but striving towards value-based care.
In light of the recently released 2018 data, we wanted to revisit our existing analyses in the last few years. We’ll identify emerging trends and explore future implications of performance within the context of CMS’s introduction of “Pathways to Success”, a new program finalized in December of 2018.
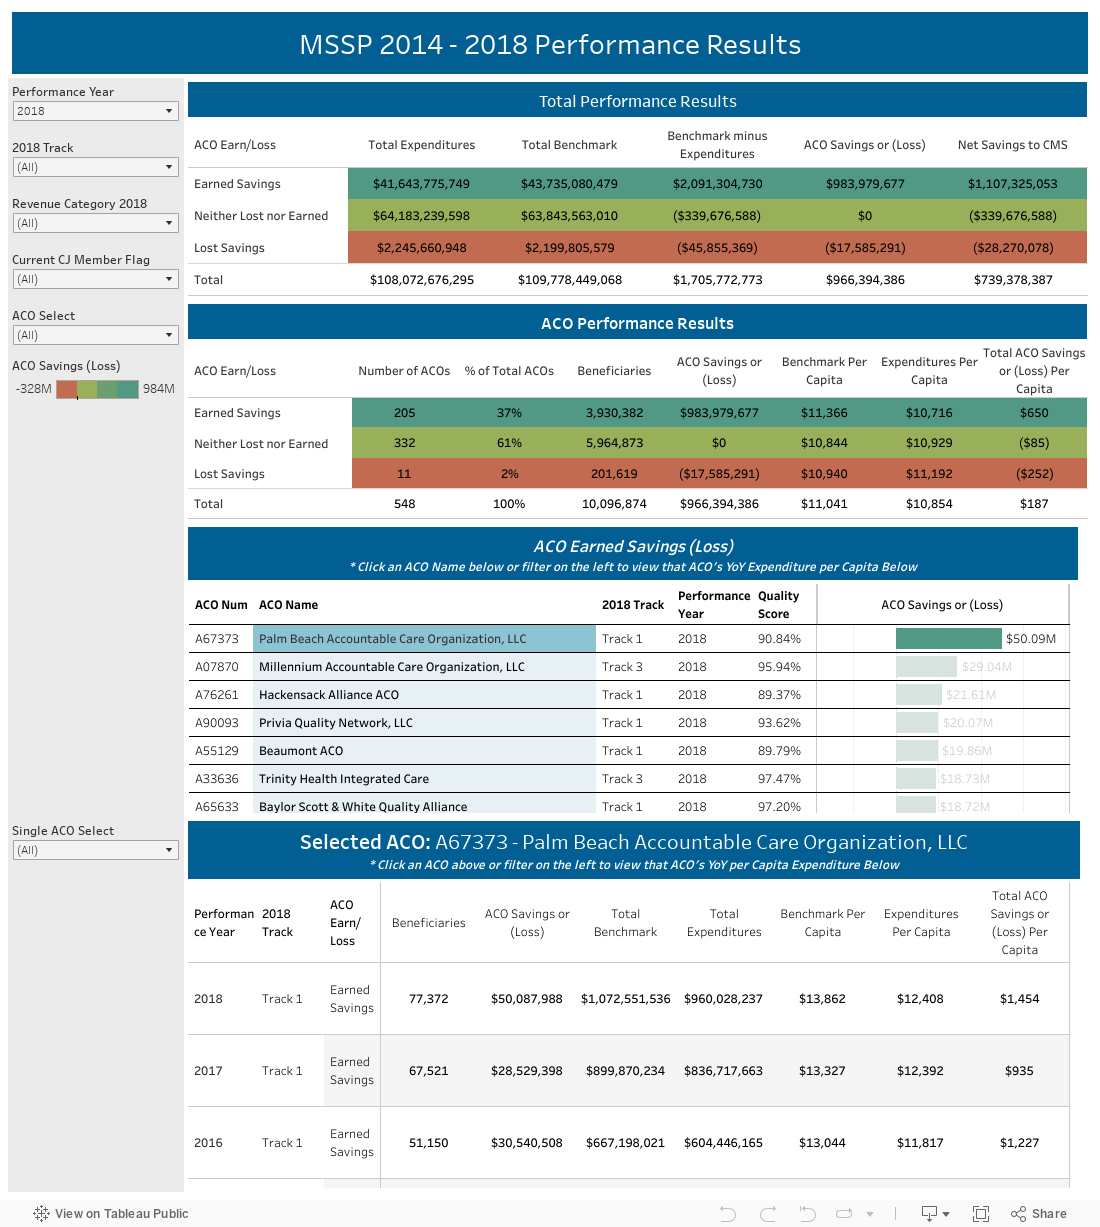
Utilizing CareJourney data analytics, we have aggregated data from 2014 – 2018 in an interactive dashboard below, empowering users with an accessible and digestible view to mine their own additional insights.
CMS Savings Overview
| 2014 – 2018 PUF Results Over Time | ||||||
|---|---|---|---|---|---|---|
| Performance Year | No. of ACOs | Total Benchmark | Total Expenditures | Benchmark Minus Expenditures | Earned Savings | Net Savings to CMS |
| 2014 | 333 | $52,885M | $52,594M | $291M | $341M | ($49.8M) |
| 2015 | 392 | $73,298M | $72,868M | $429M | $646M | ($216.3M) |
| 2016 | 432 | $81,377M | $80,725M | $652M | $691M | ($39.3M) |
| 2017 | 472 | $94,914M | $93,820M | $1,095M | $781M | $313.7M |
| 2018 | 548 | $109,778M | $108,073M | $1,706M | $966M | $739.4M |
It is important to understand 2018 performance results in the context of previous years data. 2017 represented the first year in which CMS not only had net savings, but enough to absolve the previous three years of loss. This pivot is further emphasized as 2018 doubled net savings to CMS, even after paying out $966 million in shared savings. There is also a natural increase in total cost in the program year over year; however, it is promising to see this absorbed as net savings for both CMS and ACOs. While these savings represent only a fraction of the program’s total cost, continued trends in savings encourage the longevity of the MSSP program, and emphasis on value-based care.
ACO Performance Results
| 2018 ACO Performance Results | |||||||
|---|---|---|---|---|---|---|---|
| ACO Earn/Loss | No. of ACOs | % of Total ACOs | Beneficiaries | ACO Savings or (Loss) | Benchmark per Capita | Expenditures per Capita | Total Savings or (Loss) |
| Earned Savings | 205 | 37% | 3,930,382 | $983,979,677 | $11,366 | $10,716 | $650 |
| Neither Lost nor Earned | 332 | 61% | 5,964,873 | $0 | $10,844 | $10,929 | ($85) |
| Lost Savings | 11 | 2% | 201,619 | ($17,585,291) | $10,940 | $11,192 | ($252) |
| Total | 548 | 100% | 10,096,874 | $966,394,386 | $11,041 | $10,854 | $187 |
At first glance, 2018 included a record-breaking number of 548 ACOs participating in MSSP covering 10 million beneficiaries. Despite the rising adoption of downside financial risk programs in 2018, only 2% lost savings while 37% earned $650 per capita in savings on average. Within our CareJourney membership base, ACOs earned 40% more in savings per capita compared to others. PBACO, Privia Quality Network, Beaumont ACO & Trinity Health CareJourney members were among the top 10 in total earned savings. We are excited to partner with organizations just as dedicated to value-based care, and look forward to continuing to share clinically relevant insights with our members.
Benchmarks also play a central role in the overall performance outcome, as ACOs who made savings historically had higher benchmarks, and outspent other ACOs. 2017 represented a pivotable moment where winners had both a lower benchmark and lower expenditures than other ACOs; 2018 data corroborates this trend.
Pairing the 2018 results with longitudinal data, we can visualize the emerging trends of those who made savings vs. those who did not. There is a convergence of the delta as more ACOs earn more savings, resulting in a 22.4% decrease in stratification of ACOs, meaning over time organizations are aligning in similar savings rather than a wide range of outliers. As the lines narrow between the “haves & have nots,” we can predict optimistic performance for ACOs & CMS in 2019.
If you’d like a detailed view of a specific ACO’s performance over time, explore the interactive dashboard below.
Future of MSSP
As CMS expands the Pathways to Success ruling, we want to understand how that will impact the current positive trend in performance. There are two key differences that will influence how ACOs perform in the new program: risk and experience. Currently, ACOs are allowed six years before being required to take on downside risk, enabling some organizations to enter the program with less focus on quality and more focus on the bottom line. Pathways to Success aims to address this by requiring ACOs to start bearing risk in two years for new ACOs and three years for low revenue ACOs, contributing to a healthier risk sharing marketplace. Let’s first evaluate 2018 ACO results in the context of risk by current track segmentation.
| 2018 Results Segmented by MSSP Track | |||||||
|---|---|---|---|---|---|---|---|
| MSSP Track | No. of ACOs | No. of Beneficiaries | ACO Earned Savings or (Loss) | Benchmark per Capita | Expenditures per Capita | Total Savings Per Capita | |
| Track 1 | 453 | 8,059,189 | $724.8M | $10,985 | $10,818 | $167 | |
| Track 1 + | 52 | 1,088,662 | $102.6M | $11,317 | $11,057 | $259 | |
| Track 2 | 7 | 112,116 | $25M | $10,925 | $10,377 | $549 | |
| Track 3 | 36 | 836,907 | $114M | $11,373 | $11,116 | $257 | |
Based on 2018 ACO performance, it’s clear that while most ACOs huddle in Track 1, those with zero risk, there can be more savings opportunities as you move through the tracks, gaining either risk or experience in the program. However, there is no conclusive trend, considering Track 3 and 1+ have similar results while Track 2 remains a large outlier. One explanation for these results could be due to the sample size, given the small number of ACOs in this specific track.
This further emphasizes CMS’s current initiative to funnel more ACOs into more risk for mutual rewards. “Pathways to Success is a bold step towards quality healthcare at a lower cost through competition and beneficiary engagement,” said CMS Administrator Seema Verma. “The rule strikes a balance between encouraging participation in the ACO program and advancing the transition to value, ultimately protecting taxpayers and patients. Medicare can no longer afford to support programs with weak incentives that do not deliver value.”
| 2018 Results Segmented by ACO Start Date in MSSP | |||||||
|---|---|---|---|---|---|---|---|
| Years in MSSP | 2018 Performance | ||||||
| ACO Start Date | No. of ACOs | Benchmark per Capita | Expenditures per Capita | Generated Savings (Loss) per Capita | Earned Savings (Loss) per Capita | Net CMS Savings (Loss) | |
| 2012 | 58 | $11,327 | $10,992 | $337 | $181 | $155 | |
| 2013 | 49 | $11,070 | $10,830 | $240 | $149 | $91 | |
| 2014 | 73 | $10,762 | $10,550 | $169 | $90 | $79 | |
| 2015 | 65 | $10,987 | $10,837 | $135 | $66 | $70 | |
| 2016 | 91 | $10,787 | $10,627 | $152 | $109 | $42 | |
| 2017 | 89 | $10,576 | $10,439 | $121 | $81 | $40 | |
| 2018 | 123 | $10,733 | $10,719 | $8 | $34 | -$27 | |
Another key factor towards success is an ACO’s longevity in the program. The 2018 results show a supportive trend for Pathways to Success, as those with more experience in MSSP earn more savings, both at organization level and for CMS. Specifically, the $109 spike in earned savings for ACOs who started in 2016, and a 40% increase in net CMS savings from a year 2 to 3 ACO start, align with the new program’s requirements for taking on risk bearing arrangement over a 5 year agreement period.
Furthermore, a majority of ACOs with top overall savings in 2018 have also been enrolled in the program for multiple years. PBACO (Palm Beach Accountable Care Organization), a CareJourney member, had a record-breaking year for all of MSSP, accounting for over 50 million in savings. They were among the first to join, starting the program in July 2012. Following the coattails of PBACO, the next top four ACOs (Millennium ACO, Hackensack Alliance ACO, Privia Quality Network and Beaumont ACO), several of which are also CareJourney members, all have at least four years’ experience in the program and earned 90 million in combined savings. While all five started in Track 1, only one has moved into a risk bearing agreement since then. This formula for success is what CMS hopes to capture in the new program: incentivize ACOs to deliver high quality care at lower costs, while also holding them accountable when they do not. We look forward to seeing how the Pathways to Success requirements on risk act as a multiplier to experienced ACO performance in both cost and quality of care.
Overall, it is promising to see a positive performance trend in MSSP continuing to grow year over year. While we are just now beginning to see slight emergence of those taking on risk, it will be just as important for those with experience in the program to continue earning savings and delivering great care. CMS’s Pathways to Success should accelerate those mutual savings and re-invigorate ACOs that are serious about delivering high value care.
Learn More
Similar to the dashboard below, CareJourney’s tools provide the data analytics that users need to actively benchmark ACO performance, identify opportunities for cost savings, and evaluate quality of care.
Interested in learning more?
Request a Demo