Introduction
In 2021, CMS announced the ambitious goal to have all Medicare beneficiaries enrolled in a two-sided risk model by 2030. For organizations looking to jumpstart their experience in downside-risk alternative payment model (APM) programs, two CMS models fit the bill: the Medicare Shared Savings Program (MSSP) or the ACO Realizing Equity, Access, and Community Health (ACO REACH) Model. The newest CMS model announced in June 2023, Making Care Primary (MCP), will also have a two-sided risk track.
Making the transition to two-sided risk from traditional fee-for-service (FFS) Medicare or from an upside-only risk model is not an easy decision. Upcoming CMS deadlines make this summer a busy time for new and existing accountable care organizations to prepare for Performance Year 2024. Financial benchmarking is an essential part of the process to prepare for two-sided risk.
The Role of Financial Benchmarking
Financial benchmarking involves modeling an organization’s historical performance against the alignment and expenditure rules of a given APM model. When considering joining a value-based care model, these analytics become essential in assessing the potential financial impact of participation.
What is a Benchmark?
Before we dive into calculating our benchmark, it is critical to ensure a common definition of the word itself. The term “benchmark” is used in many contexts in the Value-Based Care landscape, and often used interchangeably with other terms, like “projection,” that, depending on context, can result in vastly different interpretations of the data.
For the purpose of this blog, the following definitions will be used:
- “Benchmark” is used for a series of calculations performed on historical data that is used to set a target price for the average beneficiary being treated. A benchmark consists of four key elements unique to the organization and their aligned population.
- “Projection” is used for a financial modeling process that seeks to predict the performance year’s population and how it will perform versus the benchmark.
The 4 Components of a Benchmark:
- Aligned Population
- Historical Expenditure
- Risk Adjustment
- Regional Expenditure
Alignment
Medicare beneficiaries see an average of seven providers in a year.3 Alignment refers to a series of logic that determines which provider has primary responsibility for a beneficiary’s healthcare. An ACO is responsible for the quality and cost of all beneficiaries that are “aligned to” their participating providers. This term is often used interchangeably with terms like “attribution” or “empanelment.” Understanding which beneficiaries will be aligned to your ACO under the given model rules is a critical first step in calculating your benchmark.
Most CMS models follow claims-based alignment to assign beneficiaries to an NPI and/or entity, such as a practice group, which we will refer to as a TIN for Tax ID Number. Claims-based alignment is often determined based on a specific set of procedure codes that fall under the bucket of “E&M” (Evaluation & Management). Typically these are HCPCS codes that begin with the prefix “992”.4 Between models, the logic used to calculate claims-based alignment can vary, for example:
- MSSP: Plurality of E&M spend for current 12 months of Performance Year (“PY”), OR 12 month trailing (prior Oct – Sep) of PY
- REACH: Plurality of E&M spend for 24 month trailing (prior Jul – Jun) of PY
In both the REACH & MSSP models, primary care providers have priority over specialists for alignment, even if a specialist has billed the plurality of E&M codes.
Understanding your aligned population will help your organization answer the following questions to better inform your readiness to go into a VBC model:
- What is the total number of aligned beneficiaries?
- How has your population been trending year over year?
- Is your population growing or remaining steady?
- Are your patients “churning” – aligned to your ACO during the alignment period but not eligible during the performance period (deceased, switched to an MA plan, or aligned to another ACO)
In the example below, this MSSP ACO has had relatively stable prospective alignment during all three benchmark years (BY), with a slight increase in 2022.
| Calculate Historical Benchmark | BY1 2020 |
BY2 2021 |
BY3 2022 |
|---|---|---|---|
| Assigned Beneficiaries | |||
| [A1] Assigned Beneficiaries | 35,802 | 35,699 | 36,268 |
| [A2] Person-Years | 34,679 | 34,599 | 35,177 |
Notice that there are two alignment numbers presented – Assigned Beneficiaries [Line A1] and Person-Years [Line A2], with the Person-Years alignment consistently approx. 3% lower than the total Assigned Beneficiaries. Using the “Person-Years” calculation ensures that we only account for the period of time that the aligned beneficiaries were enrolled in Medicare – for example if a beneficiary aligned to our ACO became Medicare eligible due to age on July 1, 2022, that beneficiary would account for 1 Assigned Beneficiary in row A1, and 0.5 Person-Years in Row A2 for BY3. Since we only want to account for the time the beneficiary was enrolled in Medicare in our benchmark calculation, we will leverage the Person-Years alignment number to calculate our ACO’s PMPY expenditure.
Want to see financial benchmarking data in action?
Request a headwind/tailwind analysis for your providers.
Historical Expenditure
The next input required to build a benchmark is your aligned population’s historical expenditure. In a Total Cost of Care (TCoC) model like MSSP or ACO REACH, primary care and specialty care expenditure will be used to calculate the historical benchmark.
Having access to 100% of Medicare Part A and Part B claims for your aligned population will be critical in ensuring you have an accurate calculation of historical expenditure.
We’ll couple this with risk adjustment in the next step to get a risk-adjusted expenditure for your population so we can make appropriate comparisons of expenditure between populations.
The example below demonstrates TCoC for the ACO’s aligned population during their benchmark years. For MSSP ACOs, the per capita expenditures are calculated for the four Medicare eligibility categories (Aged/dual, Aged/Non-Dual, Disabled, End Stage Renal Disease).
| Calculate Historical Benchmark | BY1 2020 |
BY2 2021 |
BY3 2022 |
|---|---|---|---|
| Assigned Beneficiaries | |||
| [A1] Assigned Beneficiaries | 35,802 | 35,699 | 36,268 |
| [A2] Person-Years | 34,679 | 34,599 | 35,177 |
| Trended Historical Benchmark Expenditures | |||
| Total Paid Amount ($) | $340,480,895 | $370,413,020 | $398,122,331 |
| [B] Per Capita Expenditures | |||
| All Assigned | $9,818 | $10,706 | $11,318 |
| ESRD | $68,267 | $70,802 | $72,032 |
| Disabled | $9,419 | $10,605 | $11,231 |
| Aged/dual | $16,515 | $15,830 | $16,817 |
| Aged/non-dual | $8,434 | $9,571 | $10,199 |
Risk Adjustment
Risk adjustment is one of the most critical steps to success in value-based care. Risk adjustment is based on the central concept that more medically complex patients should have higher expenditure than a less medically complex patient. A risk adjustment factor (RAF) score uses demographic and disease factors to normalize spend based on the patient or population’s relative risk.
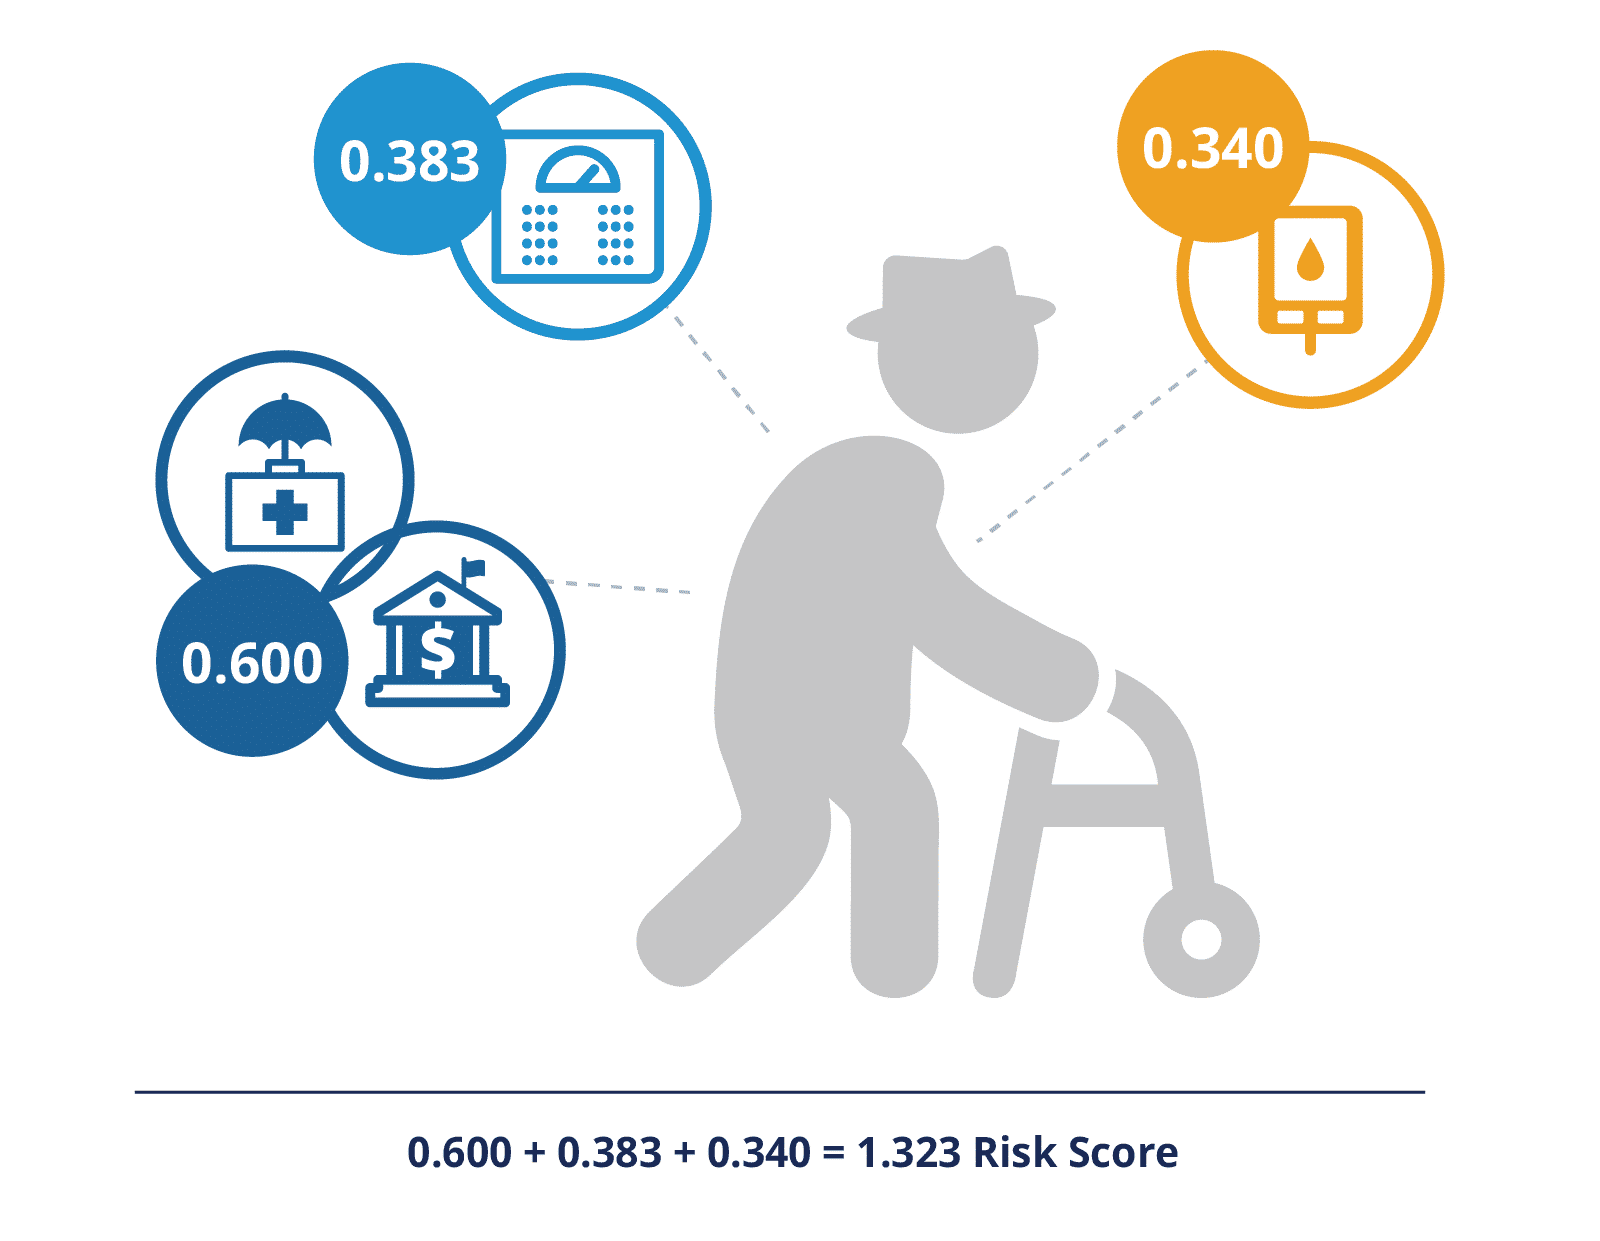
CMS alternative payment models use the Hierarchical Condition Categories (HCC) risk model. The HCC model follows prospective attribution of chronic conditions, where diagnoses from the previous year are factored into the patient’s HCC score for the current year. Each condition is assigned a different weight, with certain interacting conditions being weighted more heavily. In the example below, we can interpret this Medicare beneficiary’s 1.323 HCC score to mean that due to their comorbidities and demographic factors, this patient is expected to cost 1.323 more than the average beneficiary in the performance year.
Different HCC models use a different lookup table to assign weights to each diagnosis – for example MSSP uses a blend of v.22 and v.24, while ACO REACH uses only v.24. In 2024, MA plans will begin incorporating HCC v.28, given historical precedence we can assume v.28 logic will begin to be incorporated into other CMS models in the future.

- 72 year-old, dual eligible male (0.600)
- Morbid obesity (0.383)
- Diabetes with chronic complications (0.340)
Risk score: 0.600 + 0.383 + 0.340 = 1.323
The first three inputs (Alignment, Historical Expenditure, and Risk Adjustment) will be combined to come up with a risk-adjusted, per-beneficiary per-year (PBPY) expenditure for your aligned population. A few adjusters will also be applied:
- Inflation adjustment
- Geographic Adjustment Factor (GAF) to account for geographic variations in healthcare expenditure
CareJourney is hosting a webinar Tuesday, August 8 at 1pm ET to discuss a beneficiary cohort comparison approach to support accurate comorbidity coding and documentation. Register here.
Regional Expenditure
The final core component to generating a benchmark is the regional expenditure, or the average expenditure of the Medicare FFS cohort living in the same geography as your population. The definition of the region will vary by payment model. In calculating the final benchmark for your population, the risk-adjusted PBPY expenditure for your aligned population will be blended with the risk-adjusted PBPY regional expenditure. This blend benefits participants who are already providing more efficient care compared to the regional average.
In order to evaluate an APM, an organization should compare their claims-aligned PBPY expenditure against the regional PBPY expenditure. If their historical experience is more efficient than the region, they have a “tailwind” – all else being equal in the performance year, they are likely to earn savings. If their historical expense is higher than the region , they likely have a “headwind” and may need to change their current care models to head in the direction of savings. Some CareJourney members seek out providers with a headwind as it is a good indicator of an opportunity for improvement.

Our example ACO has a risk-adjusted historical PMPY of $11,251 once the MSSP weighted blend is applied to the three benchmark years. The region’s risk-adjusted historical PMPY is $10,859.
| Calculate Historical Benchmark | BY1 2020 |
BY2 2021 |
BY3 2022 |
Benchmark |
|---|---|---|---|---|
| Assigned Beneficiaries | ||||
| [A1] Assigned Beneficiaries | 35,802 | 35,699 | 36,268 | |
| [A2] Person-Years | 34,679 | 34,599 | 35,177 | |
| Trended Historical Benchmark Expenditures | ||||
| Total Paid Amount ($) | $340,480,895 | $370,413,020 | $398,122,331 | |
| [C] CMS-HCC Risk Score | ||||
| All Assigned | 1.318 | 1.287 | 1.318 | |
| ESRD | 3.326 | 3.359 | 3.240 | |
| Disabled | 1.427 | 1.465 | 1.464 | |
| Aged/dual | 2.051 | 1.975 | 2.088 | |
| Aged/non-dual | 1.204 | 1.180 | 1.222 | |
| Blend Proportion | 0.100 | 0.300 | 0.600 | |
| All Assigned | $1,078 | $3,321 | $6,853 | $11,251 |
| ESRD | $7,094 | $20,870 | $43,219 | $71,182 |
| Disabled | $1,066 | $3,222 | $6,739 | $11,026 |
| Aged/dual | $1,888 | $5,156 | $10,090 | $17,134 |
| Aged/non-dual | $937 | $2,955 | $6,119 | $10,012 |
| [K] Risk-Adjusted Regional Expenditures Afer Accounting for ACO Assigned Beneficiary Health Status (ACO Risk-Adjusted Regional Average Expenditure Amount) ($) | ||||
| All Assigned | – | – | – | $10,859 |
| ESRD | – | – | – | $71,466 |
| Disabled | – | – | – | $10,746 |
| Aged/dual | – | – | – | $14,831 |
| Aged/non-dual | – | – | – | $9,721 |
Due to this headwind, a conservative organization may elect not to participate in MSSP with this group of providers. An organization that is bullish on its ability to reduce unnecessary expenditures may find this benchmark full of opportunity. Their next step would be to further drill into their historic performance to identify areas of improvement. They may also consider participating in an upside only risk track to start.
Putting It All Together
The sections above describe the four core elements of an APM benchmark: 1) aligned population 2) historical expenditure 3) risk adjustment and 4) regional expenditure. In order to calculate the regionally-adjusted historical benchmark, the ACO’s claims aligned historical expenditures are blended with regional expenditures. Blend ratios are dependent on APM, performance year and efficiency relative to region.
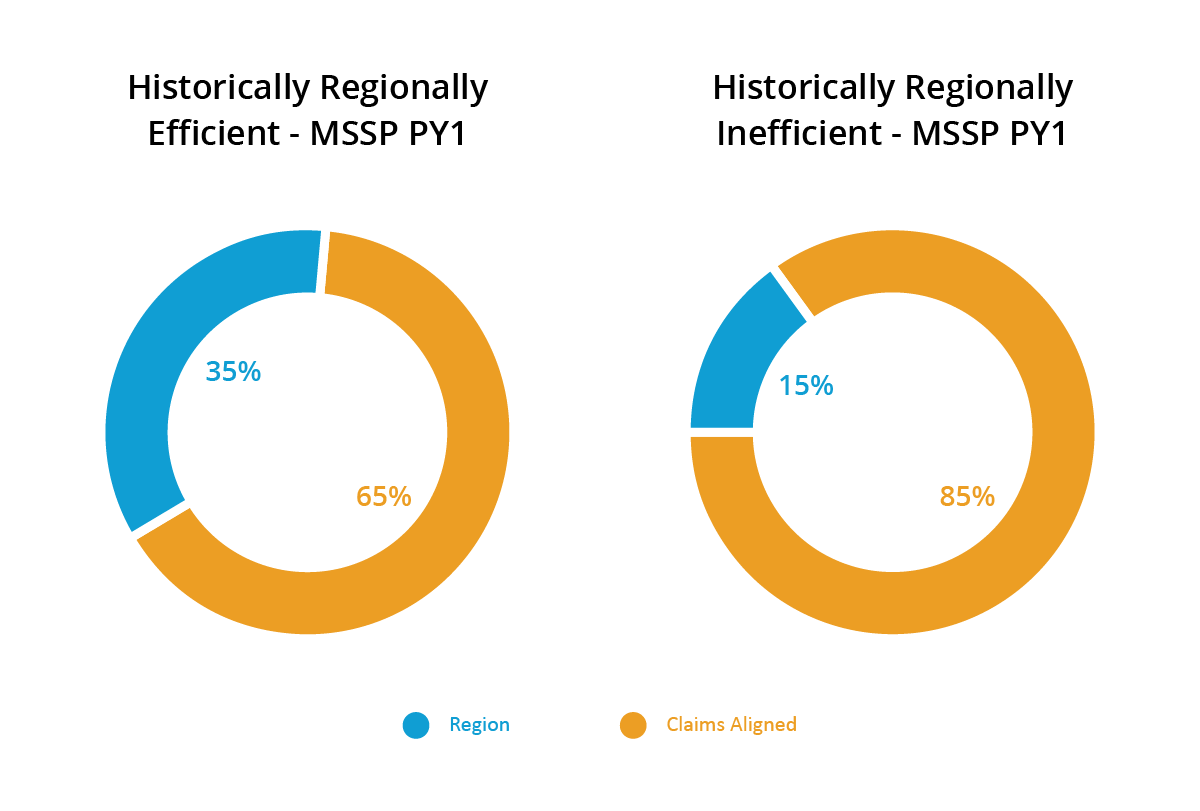
For an MSSP ACO in their first performance year, they would be subject to the following blends, depending on their relative efficiency.

As a reminder, our example ACO has a headwind. In other words, they are regionally inefficient. Their claims-aligned risk-adjusted historical PMPY ($11,251) will account for 85% of their benchmark in PY1 and the region’s risk-adjusted historical PMPY ($10,859) will account for 15%. Their regionally adjusted historical benchmark will be $11,193. As this MSSP ACO continues through their agreement period, the region’s performance will progressively have a greater influence on their benchmark. It will be a 50/50 split in PY4, encouraging the ACO to achieve efficiencies to “catch up” to the rest of their region.
Next Steps
Now that we have our final Benchmark for our model(s) of interest, we can use this value to inform our critical participation decisions, including:
- Which provider(s) (for ACO REACH) or provider groups (for MSSP and ACO REACH) should I go into the model with?
- How can I optimize my roster for this performance year?
- What are my projected savings for a given performance year?
- Should my organization participate in MSSP or ACO REACH in future performance years?
- Which model track is best for my organization in future performance years?
- How should I structure sub-capitation or other gainsharing agreements?
Conclusion
Accurate financial benchmarks are critical in evaluating the potential impact and feasibility of joining or taking on more risk in a VBC model. Having a robust historical claims experience ensures that your financial benchmarking predictions are accurate and actionable, steering your organization to the model that is the best fit for your patients and providers.
How CareJourney Can Help
No matter where you are on in your value-based care journey, there are several ways in which CareJourney can support your organization, including:
- Calculating financial benchmarks for your participating providers to inform your model go/no-go decision and model track selection
- Simulating success with a given roster of providers, including evaluating new groups, to optimize your model participant list
- Understanding utilization of services from an attributed population and cultivating strong preferred provider and facility networks.
- Understanding provider performance and providing the insights needed for performance management conversations.
- Leveraging CareJourney claims ingestion and transformation Population Insights tool to track care interventions in real time.
Many CareJourney members are top-performing ACOs, including Rush Health, PBACO, Privia, Silver State, DVACO, and South Texas ACO Clinical Partners. If you are currently a member and interested in how CareJourney can help you gain insights into designing and managing a value-based organization, please reach out to your Member Services representative for more information. If you are not a CareJourney member, please request a meeting with our APM expert or email us at info@carejourney.com.
Want to see financial benchmarking data in action?
Request a headwind/tailwind analysis for your providers.
- https://innovation.cms.gov/strategic-direction-whitepaper
- https://innovation.cms.gov/innovation-models/making-care-primary
- https://www.cms.gov/blog/cms-innovation-centers-strategy-support-person-centered-value-based-specialty-care
- Commonly used evaluation and management HCPCS codes are 99201-99205 (New Patient) and 99211-99215 (Established Patient), usually delivered in an office setting. Models may also use site of service specific evaluation codes, such as 99304-99310 (SNF) or 99334-99337 (home care).
