By Ben Bigelow
Last week, CMS published the 2017 performance year results for the Medicare Shared Savings Program (MSSP). It comes on the heels of a new proposed rule from CMS that is meant to drive more accountable care organizations (ACOs) to take on downside risk, something few ACOs have done in recent years.
Given the proposed changes to the program – as well as new research about potential cost-savings from physician-led ACOs– we wanted to revisit our analysis of the 2016 performance year results to see how things have changed.
Question 1: How many ACOs came in under (or over) target
Question 2: How much did the winners save – and how much did the ACO that didn’t make savings, lose?
| 2017 | |||
|---|---|---|---|
| No. (%) | Beneficiaries | Total Savings (Loss) | |
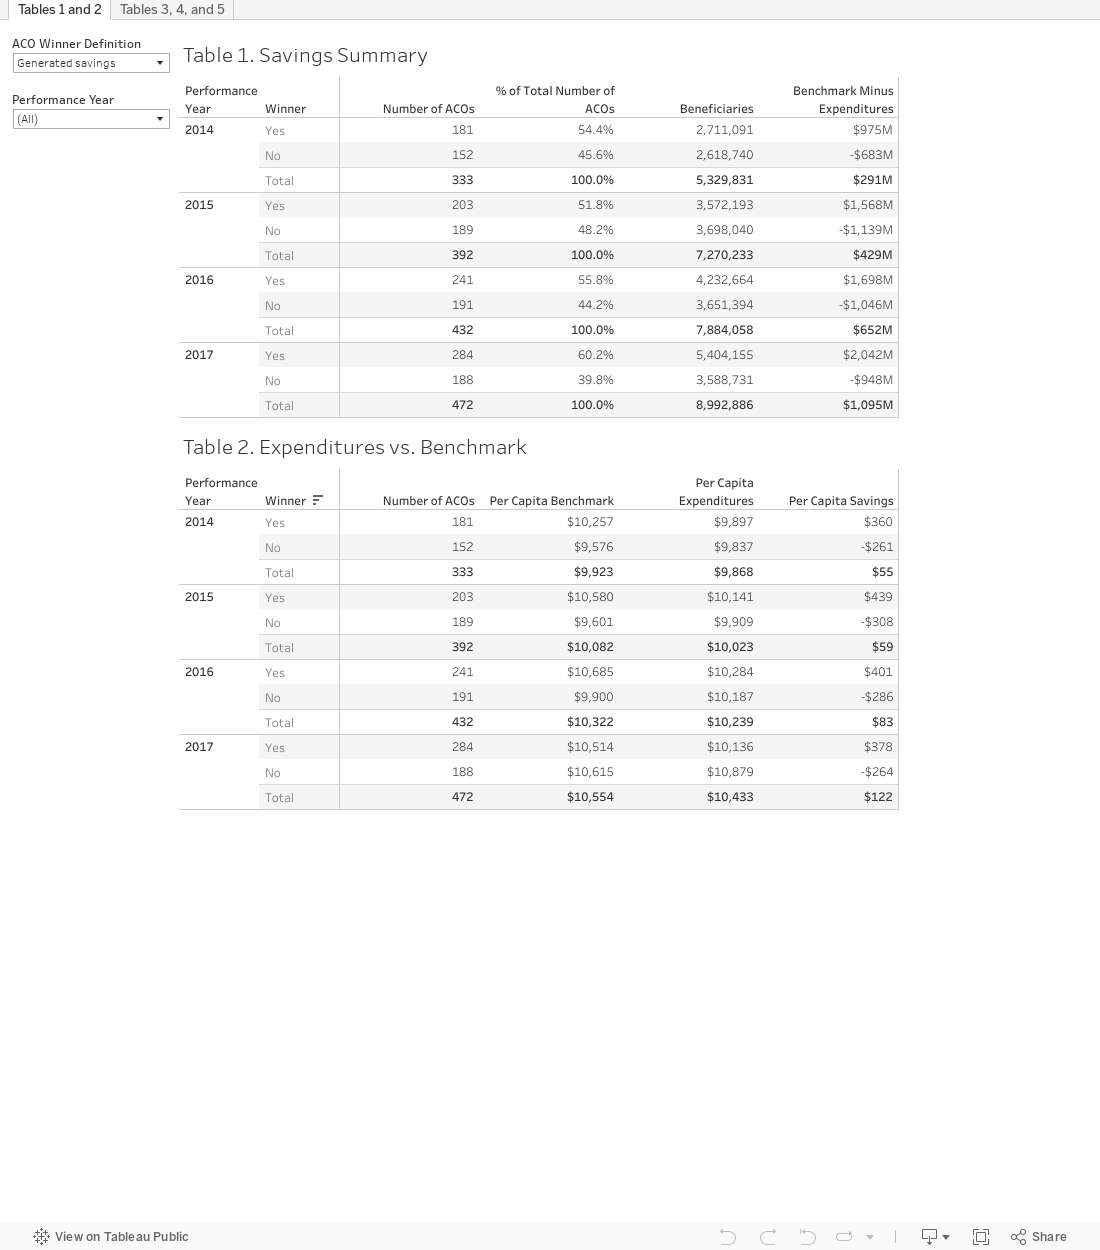
| ACOs that made Savings | 284 (60.2%) | 5,404,155 | $2,042,493,507 |
| ACOs that didn’t make Savings | 188 (39.8%) | 3,588,731 | -$947,949,159 |
| Total | 472 | 8,992,886 | $1,094,544,348 |
In 2017, the MSSP program had 472 participating ACOs with a covered population of 9 million beneficiaries. Of the 472 ACOs, 284 (60.2%) came in under benchmark, with total savings of $2 billion relative to their benchmarks. The remaining 188 ACOs (39.8%) delivered a loss of $948 million to CMS, resulting in a net savings of $1.1 billion.
Question 3: Did the winners spend less than the other ACOs – or did they just have higher benchmarks to compare themselves against?
| 2017 | |||
|---|---|---|---|
| Per Capita Benchmark | Per Capita Expenditures | Per Capita Savings (Loss) | |
| ACOs that made Savings (n=284) | $10,514 | $10,136 | $378 |
| ACOS that didn’t make Savings (n=188) | $10,615 | $10,879 | -$264 |
| Total (n=472) | $10,554 | $10,433 | $122 |
In previous years, winners have benefitted from high benchmarks, even though they outspent the other ACOs. However, 2017 is the first year where winners have had both a lower benchmark and lower expenditures than other ACOs. The winners’ benchmark was $100 lower than the rest, and their expenditures were $743 lower. This resulted in a net per capita savings of $378, roughly 3.6% of average per capita expenditures.
Question 4: Did CMS come out ahead or behind?
| Total Benchmark | Total Expenditures | Savings to CMS | Earned Savings (Loss) | Net Impact to CMS | |
|---|---|---|---|---|---|
| 2014 | $52,885 m | $52,594 m | $291 m | $341 m | -$50 m |
| 2015 | $73,298 m | $72,868 m | $429 m | $646 m | -$216 m |
| 2016 | $81,377 m | $80,725 m | $652 m | $691 m | -$39 m |
| 2017 | $94,914 m | $93,820 m | $1,095 m | $781 m | $313.7m |
| Total | $302,474 m | $300,007 m | $2,467 m | $2,459 m | $8.4 m |
2017 was a year of firsts, as the program ran in the black for the first time. After paying out $781 million in shared savings, Medicare ACOs saved the program $314 million, enough to wipe out the previous three years of red ink. Still, these net savings represent only a fraction of a percent of the program’s total cost.
Question 5: Are ACOs that have been in the program longer doing better?
| 2017 | ||||||
|---|---|---|---|---|---|---|
| Start Date | No. | Benchmark | Expenditures | Savings (Loss) | Earned Savings (Loss) | Net Savings (Loss) |
| 4/2012 | 15 | $11,208 | $10,807 | $401 | $210 | $191 |
| 7/2012 | 48 | $10,862 | $10,705 | $158 | $125 | $32 |
| 2013 | 62 | $10,699 | $10,469 | $230 | $138 | $92 |
| 2014 | 79 | $10,524 | $10,317 | $207 | $92 | $115 |
| 2015 | 76 | $10,583 | $10,515 | $69 | $66 | $3 |
| 2016 | 96 | $10,454 | $10,420 | $34 | $60 | -$26 |
| 2017 | 96 | $10,204 | $10,183 | $20 | $41 | -$20 |
| Total | 472 | $10,554 | $10,433 | $122 | $87 | $35 |
It should come as no surprise that more experienced ACOs saved more than new ACOs. The oldest ACOs – those in the April 2012 cohort – saved $191 per capita, while 2016 and 2017 entrants lost $26 and $20 per capita, respectively. Interestingly, although only 63 of the 472 ACOs were started in 2012, they had significantly higher benchmarks and expenditures than the most recent cohort. ACOs in the April 2012 cohort had a benchmark of $11,208, compared to $10,204 for the 2017 cohort, a difference of over $1,000. Per capita expenditures were over $600 higher for the oldest cohort compared to the newest cohort.
Question 6: Do ACOs with downside risk perform better or worse than ACOs without downside risk?
| 2017 | ||||||
|---|---|---|---|---|---|---|
| Track | No. | Benchmark | Expenditures | Savings (Loss) | Earned Savings (Loss) | Net Savings (Loss) |
| Track 1 | 433 | $10,523 | $10,403 | $120 | $84 | $36 |
| Track 2 | 6 | $10,866 | $10,758 | $107 | $33 | $75 |
| Track 3 | 33 | $10,841 | $10,704 | $138 | $115 | $22 |
| Total | 472 | $10,554 | $10,433 | $122 | $87 | $35 |
As CMS moves ACOs into taking downside risk, it’s worth examining how ACOs in different tracks performed in 2017. Perhaps counterintuitively, there seems to be little difference in performance among Track 1, Track 2, and Track 3 ACOs. Although ACOs with downside risk had higher benchmarks, they also had higher expenditures than Track 1 ACOs. Consequently, the three types of ACOs generated similar amounts of savings, between $107 and $138 per capita. Net savings to CMS varied between $22 for Track 3 ACOs to $75 for Track 2 ACOs.
If you’d like to further examine MSSP performance by year, please explore the Tableau dashboards below. These dashboards aggregate date from 2014 to 2017 to present a more wholistic view of the program.