
By Timmy Del Vecchio, graphic by Ben Bigelow
As CMS recently made unembargoed Performance Year (PY) 2017 results available to ACOs in late August, ACOs were able to view not only PY 2017 financial expenditures relative to benchmarks, but also the ACO’s overall quality score for the performance year. For an ACO that generates savings, this quality score has a direct impact on what fraction of generated savings are turned into earned savings for the ACO and its participants. As a result, even minor improvements in a quality score can have a significant impact on the realized savings total for the performance year. More importantly, quality score improvements ensure that an ACO is improving and maintaining quality of care for their assigned population.
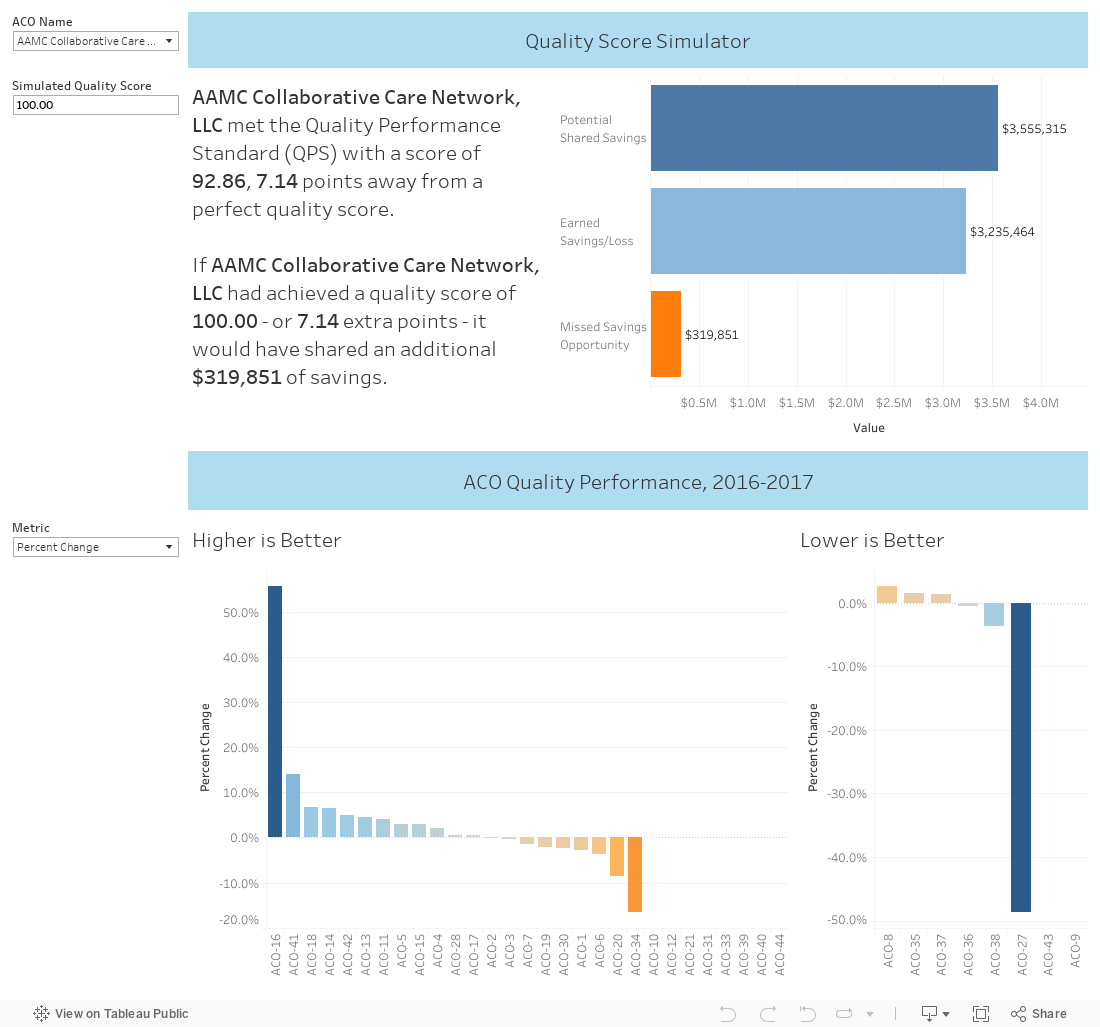
Using the 2017 ACO PUF file released by CMS, we developed a quality score simulator that shows the impact of higher quality scores on earned savings. The dashboard will also show the quality measures where the ACO improved and worsened from 2016 to 2017.
CMS Releases New Quarterly Claims-Based Quality Measures Report
In an effort to help ACOs track quality performance throughout the performance year, CMS has created a new quarterly file for ACOs called the Claims-Based Quality Measures Report. This report contains interim quality scores, calculated on a rolling 12 month basis, for seven claims-based quality measures:
- ACO-8: Risk-Standardized, All Condition Readmission
- ACO-35: Skilled Nursing Facility 30-Day All-Cause Readmission Measures (SNFRM)
- ACO-36: All-Cause Unplanned Admission for Patients with Diabetes
- ACO-37: All-Cause Unplanned Admission for Patients with Heart Failure
- ACO-38: All-Cause Unplanned Admissions for Patients with Multiple Chronic Conditions
- ACO-43: Ambulatory Sensitive Condition Acute Composite (AHRQ Prevention Quality Indicator #91)
- ACO-44: Use of Imaging Studies for Low Back Pain
The remaining quality measures used to determine the final performance year quality score are derived from other sources such as survey data and self-reported CMS Web Interface clinical quality data.
It is important to note that as a result of the CMS 2019 Physician Fee Schedule proposed rule, the claims-based quality measures bolded and italicized above would be retired. So, ACOs should keep this in mind as they determine which quality measures to focus on in the remainder of 2018 and moving forward into 2019.
CMS has also provided the mean performance rate among Shared Savings Program (SSP) ACOs, as well as the 30th and 90th percentile benchmarks. These benchmarks allow an ACO to determine which claims-based quality measures need the most improvement and establish interventions in time for the performance year cut-off. CareJourney is in the process of loading these files and developing dashboards to help ACOs track this data over time.
Turning Interim Quality Measure Scores Into Actionable Interventions
This bridge from interim quality score insights to actionable interventions is not always obvious. For example, if an ACO has a high re-admission rate relative to the national mean, is there a particular highly utilized hospital that has a high re-admission rate? If an ACO has a high unplanned admission rate for patients with multiple chronic conditions, is there a way to identify these patients within the ACO population to ensure they obtain the care they need?
One of CareJourney’s goals is to make that bridge possible. Through inpatient profile lists, our members can determine which hospitals have the highest re-admission rates, and further dive into patient and stay level details. Through patient profiles, our members can determine who their patients with multiple chronic conditions are, and within seconds, track their care model compliance.
Through AHRQ Prevention Quality Indicator dashboards, our members can see the most costly and most frequent impactable admissions and narrow down at the provider level or filter on a high need high cost patient segment. Tracking progress over time in the CareJourney tool will ensure that ACOs are improving overall quality of care and make incremental improvements to turn more of the generated savings into earned savings.
For more details and tool screenshots of these profile lists and dashboards, please visit our CareJourney overview page at https://carejourney.com/carejourney.
Using Claims to Aid in CMS Web Interface Reporting
As mentioned earlier, 15 of the 31 quality measures for 2018 are calculated via the CMS Web Interface. With the new proposed rule, there would be less CMS Web Interface measures beginning in 2019, as CMS aims to reduce the administrative burden of quality reporting. ACOs are required to self-report on these measures for a pre-selected sample of beneficiaries and submit the required data to CMS. Many of these measures require pulling data that is not available in claims (ex. HbA1c value or blood pressure values).
So, how can claims be used to aid in data collection for these 15 measures? Last year, we developed a “breadcrumbs” report for one of our members as part of our support for their CMS Web Interface reporting. In addition to merging quality data from separate provider groups into a single ready-for-upload file, we created this breadcrumbs report that runs claims data against the procedure codes found in the quality measure specification documents. The output of this report shows the quality measure (ex. breast cancer screening), code type (ex. numerator code), code (procedure HCPCS code), beneficiary, date, and provider to help locate when and where a “compliant” activity took place.
While this information is not enough to mark a patient as meeting the measure without follow up verification and health record proof, it helps members increase efficiency in tracking down records and improves quality scores by finding cases where a measure may actually be met for a beneficiary. As mentioned earlier, even a small improvement in quality score can have a large impact on earned savings. Because of this, we are working on coding this logic so that for any member, we are able to provide them with a custom report with these breadcrumb claims.
In the end, quality scores should not just be seen as a factor in a dollar amount. Improving quality scores have financial benefits in shared savings, but also encourages ACO participants to always find ways to improve the quality of care provided to beneficiaries. At CareJourney, we are proud to use our claims data and open data-driven insights to help our members achieve this progress.