8 Trends Among Top-Performing MSSP ACOs in 2022
By Shveta Mehrotra and Katie Everts
January 8, 2024
A headline you’ve likely read in the last two months sounds something like this: “In its 10th performance year, the Medicare Shared Savings Program (MSSP) saved Medicare $1.8 billion after accounting for shared savings and losses.” It probably goes on to talk about physician-led accountable care organizations (ACOs) trumping non-physician-led ACOs, and low-revenue ACOs trumping high-revenue ACOs—trends shared almost annually when MSSP performance year results are published.
But what separates top performers from lower performers? Not every ACO participant achieved shared savings—in fact, 37% of ACO participants either made no savings or generated losses in the program. Among the 15 two-sided ACOs who owed CMS money, they owed between $545K to $28M.
So, what makes up a successful ACO? A successful MSSP ACO requires a nuanced understanding of its providers, market, and patients. Armed with intelligence, these ACOs can grow into new markets, increase their quality performance, and continue to transform their care model.
- Prioritize spending more on Part B care areas compared to their peers—and achieve lower total PMPY
- Choose and recruit practice groups who spend less than their historical benchmarks as well as their county’s risk-adjusted PMPY average
- Understand who their riskiest patients are in order to deploy social determinants of health strategies and provide wrap-around services (e.g., care coordination)
- Prioritize primary care provider continuity for their patients and having PCPs provide a majority of the services rather than specialists
- Deploy more effective post-acute strategies by appropriately treating patients in home-health settings rather than over-utilizing skilled nursing facilities
How CareJourney Analyzed ACOs in MSSP
- Top decile ACOs are the top 10% of ACOs according to their overall savings rate (i.e., total benchmark expenditures minus assigned beneficiary expenditures as a percent of total benchmark expenditures). There are 48 ACOs in the top decile. Their median savings rate was 10.63%
- Bottom decile are the bottom 10% of ACOs according to their overall savings rate. There are 48 ACOs in the bottom decile. Their median savings rate was -2.06%
What Separates Top Performers from Bottom Performers?
1. ACOs in a two-sided risk model achieved an overall lower risk-adjusted PMPY compared to ACOs participating in upside only. Top decile ACOs in two-sided risk spent a lower percentage of their funds on Inpatient PMPY compared to one-sided risk ACOs. In addition, top decile ACOs, across risk levels, prioritized Part B PMPY spending over bottom decile ACOs. In contrast, bottom decile ACOs spent significantly more dollars on outpatient spending than top decile ACOs.
| Top Decile (48 ACOs) | Bottom Decile (48 ACOs) | |||
|---|---|---|---|---|
| Top decile: one-sided risk (9 ACOs) | Top decile: two-sided risk (39 ACOs) | Bottom decile: one-sided risk (30 ACOs) | Bottom decile: two-sided risk (18 ACOs) | |
| Total PMPY | $12,139 (100%) | $11,369 (100%) | $14,118 (100%) | $13,564 (100%) |
| Inpatient PMPY % | 34% | 32% | 31% | 32% |
| Part B PMPY % | 33% | 33% | 27% | 29% |
| Outpatient PMPY % | 17% | 18% | 26% | 23% |
| Post Acute PMPY % | 14% | 14% | 14% | 14% |
| Part B DME PMPY % | 3% | 3% | 2% | 2% |
Diving into post-acute spending, those with two-sided risk achieved lower SNF spend compared to one-sided risk ACOs.
Within two-sided-risk ACOs only, top decile ACOs spent more on home health agencies PMPY than the bottom decile, but less on skilled nursing facility PMPY than bottom decile ACOs. This indicates that top decile ACOs may utilize SNF services less and HHA more than bottom decile ACOs (more on this in insight #8).
| Top Decile (48 ACOs) | Bottom Decile (48 ACOs) | |||
|---|---|---|---|---|
| Top decile: one-sided risk (9 ACOs) | Top decile: two-sided risk (39 ACOs) | Bottom decile: one-sided risk (30 ACOs) | Bottom decile: two-sided risk (18 ACOs) | |
| Post Acute PMPY | $1,714 (100%) | $1,596 (100%) | $1,910 (100%) | $1,850 (100%) |
| SNF PMPY % | 47% | 45% | 54% | 47% |
| HHA PMPY % | 32% | 33% | 27% | 31% |
| Hospice PMPY % | 18% | 22% | 19% | 22% |
2. Top decile ACOs consist of a higher percentage of high-performing practice group TINs than bottom decile ACOs. Understanding historical TIN-level performance equips ACOs with a more nuanced view of their performance–and perhaps more importantly, helps ACOs choose better practice group partners.
Of practice groups from top decile ACOs, 60% outperformed their TIN-level historical benchmarks, while only 45% of practice groups from the bottom decile of ACOs did the same. Since ACOs are made up of practice groups, understanding their TIN-level performance gives ACOs greater ability to create a stronger overall roster. Only practice group TINs within the 10th to 90th percentile for patient count contributed to the analysis below.
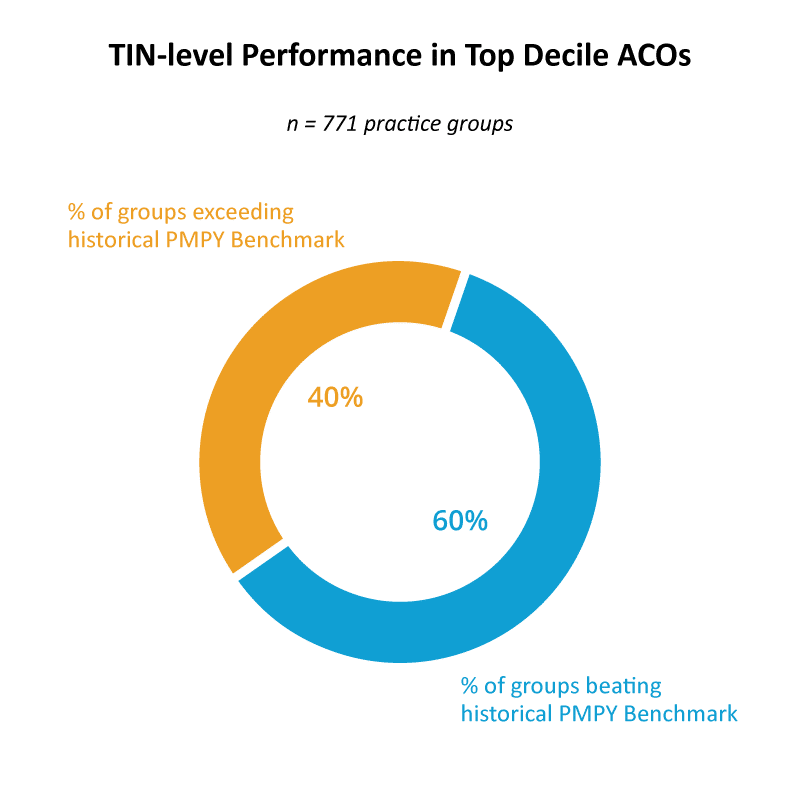
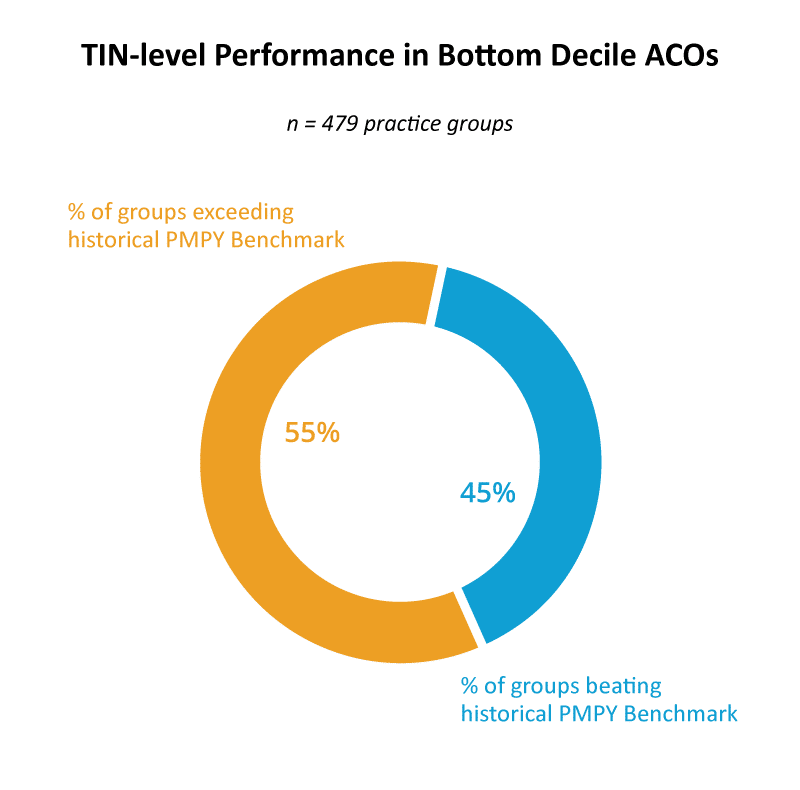
Only practice group TINs within the 10th to 90th percentile for patient count.
3. Top decile ACOs consist of TINs that are more regionally efficient than the bottom decile ACOs’ TINs. Regional efficiency is a TIN-level performance indicator that indicates how well a TIN manages costs compared to what CMS expects populations in that specific county to cost for a practice group. A score of 1 or greater indicates that those TINs are spending more than the region while a score of 1 or less indicates those TINs are spending less than the region.
When comparing TIN-level per member per year (PMPY) performance against risk-adjusted county PMPY, top decile ACOs’ weighted average regional efficiency is 0.90 while bottom decile ACOs’ weighted average is 1.14. This indicates that top decile ACO TINs spend less than a region. Only practice group TINs within the 10th to 90th percentile for patient count contributed to the analysis below.
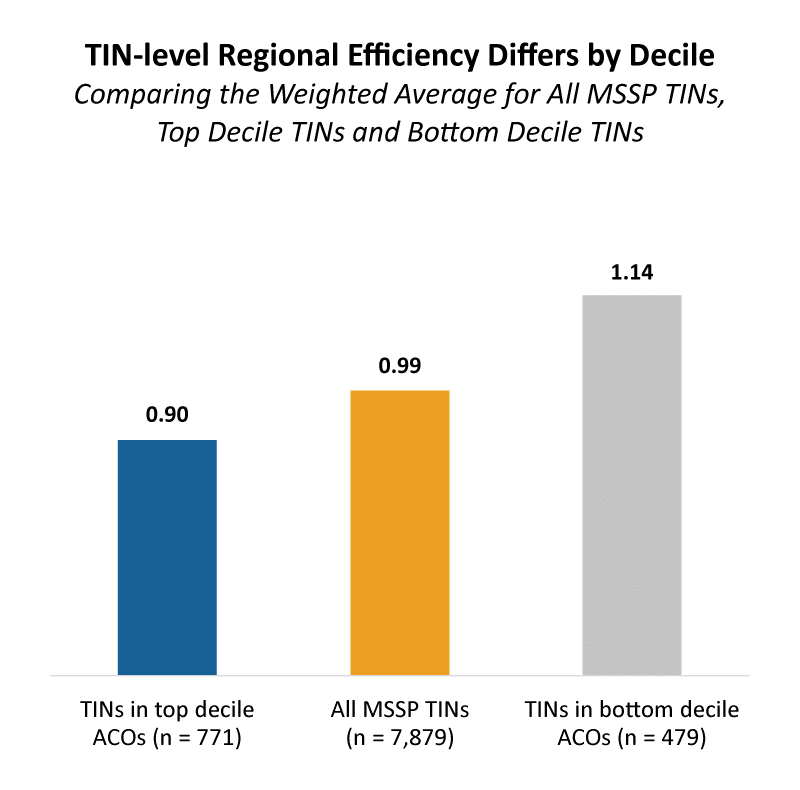
Only practice group TINs within the 10th to 90th percentile for patient count.
4. Overall, top decile ACOs consist of fewer total patients per ACO and more TINs than bottom decile ACOs. Top decile ACOs appear to deploy more practice groups and focus on smaller overall ACOs compared to bottom decile ACOs. The median top decile ACO had 23% fewer beneficiaries compared to the median ACO in the bottom decile. Top decile ACOs have a greater number of TINs per ACO—15 TINs per ACO compared to 7 TINs per ACO among bottom decile ACOs.
Beneficiary and TIN Distribution
CareJourney Report: APM | ACO Performance, APM | Practice Group Performance
| Total Number of Lives | Median Number of Beneficiaries per ACO | Median Number of TINs per ACO | |
|---|---|---|---|
| Top Decile ACOs | 556,231 | 9,352 | 15 |
| Bottom Decile ACOs | 698,676 | 12,104 | 7 |
But bottom decile ACOs have a greater share of really small TINs. This may indicate that bottom decile ACOs aren’t creating large enough practice groups—either because they don’t have the data available to predict beneficiary count, or they’re overly focusing on small beneficiary panels. ~44% of TINs that make up bottom decile ACOs are made up of 100 beneficiaries or less compared to ~37% of TINs in top decile ACOs.
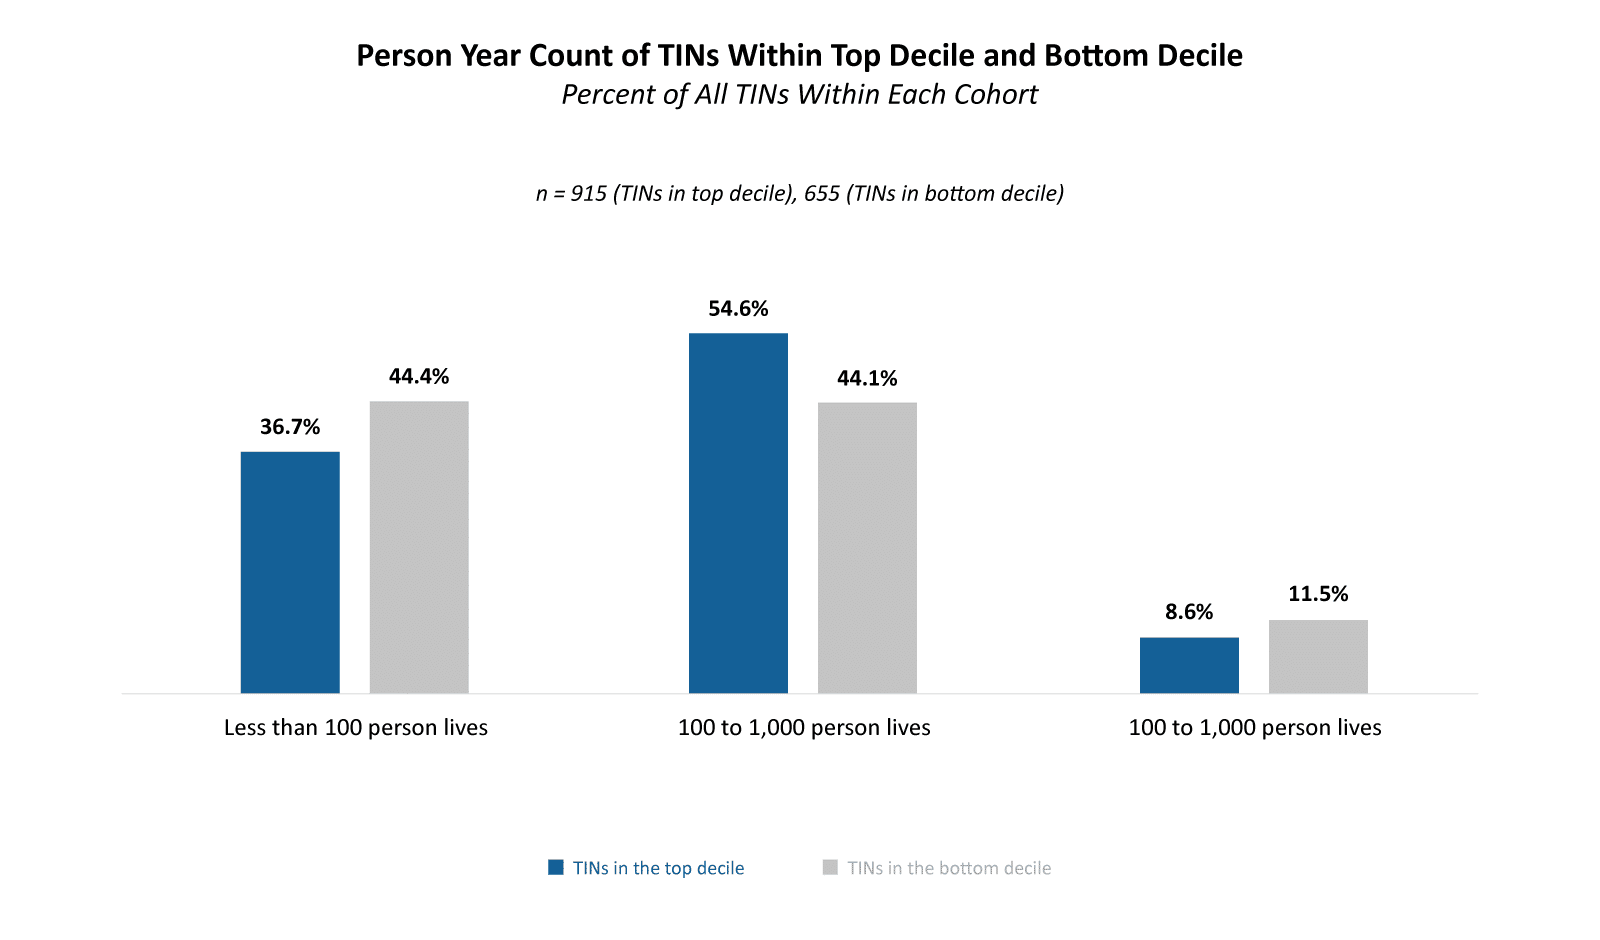
5. Top decile ACOs had a slightly higher risk score than the median of all MSSP ACOs and bottom decile ACOs—because they consist of a larger percentage of dual beneficiaries and minority groups. This indicates that top decile ACOs are either better at managing patients with more complex conditions or are better at capturing risk codes—a study that compares HCC scores of practice groups by county against county benchmarks would help answer that question.
ACOs in the top decile recorded a median HCC v24 score +.07 greater than ACOs in the bottom decile; this represents a 6% difference between the top decile ACOs and bottom decile ACOs. This trend is further supported by comparing the range between the 25th to 75th percentile.
HCC v24 Risk Scores by Median and 25th to 75th Percentile Range
CareJourney Report: APM | ACO Performance
| Median | 25th to 75th Percentile Range | |
|---|---|---|
| Top Decile ACOs | 1.06 | 0.96 to 1.14 |
| All ACOs | 1.00 | 0.94 to 1.07 |
| Bottom Decile ACOs | 0.99 | 0.92 to 1.05 |
6. While the number of overall primary care services is roughly the same between cohorts; there’s variation in who’s providing the services. Top decile ACOs provide more E&M services with primary care providers than specialists. Top decile ACOs provide 30% more primary care services with PCPs and 10% less primary care services with specialists than bottom decile ACOs. Note: we’re defining primary care services the same as MSSP (i.e., qualifying evaluation & management codes).
Primary Care Services Analysis
MSSP 2022 PUF File
| Total Number of Primary Care Services Per 1,000 Person Years | Total Number of Primary Care Services Provided by a PCP Per 1,000 Person Years | Total Number of Primary Care Services Provided by a Specialist Per 1,000 Person Years | |
|---|---|---|---|
| Top Decile | 11,314 | 4,822 | 4,346 |
| Bottom Decile | 11,257 | 3,378 | 4,776 |
| % Difference Between Top Decile and Bottom Decile | 1% | 30% | -10% |
This becomes slightly less surprising when analyzing the breakdown of provider types by decile. In the top decile, 40% of providers were PCPs and 20% were specialists. In contrast, in the bottom decile, 22% of providers are PCPs and 47% are specialists.
Share of Provider Types
MSSP 2022 PUF File
| % of PCPs | % of Specialists | % of NPs | % of PAs | % of Clinical Nurse Specialists | |
|---|---|---|---|---|---|
| Top Decile ACOs | 40% | 20% | 27% | 13% | 0.04% |
| Bottom Decile ACOs | 22% | 47% | 21% | 10% | 0.12% |
| Delta | 18% | -27% | 6% | 4% | 0% |
This analysis looks at PCP services performed by PCPs or specialists, as reported in the PUF. Relatedly, it is important to note the impact not just of who’s getting billed–but the distribution of who patients are actually attributed to. For example, managed care for a patient looks vastly different for a patient who receives an E&M service from a specialist (ex. new patient visit) and has a PCP acting as their quarterback of care than a patient who only received E&M services from that specialist.
To ensure patients are assigned to high-performing PCPs, ACOs benefit from identifying which patients in an ACO are attributed to specialists. With enhancements in claims timeliness, such as the Beneficiary Claims Data API (BCDA), ACOs can identify patients who saw a specialist (and had an E&M claim billed) to ensure those patients have an active PCP. Learn how BCDA can help your organization track attribution-related claims in a faster time frame.
7. Despite receiving more attribution, providers in top decile ACOs outperform bottom decile ACOs on annual wellness visit rate compliance and continuity of care. 52% of eligible patients in top decile ACOs receive annual wellness visits while only 37% of eligible patients in bottom decile ACOs receive the same. These ACOs may be achieving better AWV compliance due to their providers (who provide a majority of their primary care services) doing a better job at retaining patients.
Perhaps unsurprisingly given their size, top decile ACOs also provide more continuous care. They have a tighter aligned population: 76% of primary care spend (i.e., E&M spend) is spent with assigned PCPs compared to 72% among bottom decile ACOs. In addition, top decile ACOs’ average number of PCPs seen by attributed patients is slightly lower than bottom decile ACOs: 2.47 PCPs per patient vs. 2.62 PCPs per patient. This indicates that patients in top decile ACOs are receiving most of their care from fewer providers than bottom decile ACOs.
Primary Care Performance by Decile
CareJourney Report: Value-Based Care Entity Comparison
|
Annual Wellness Visit Compliance Rate
|
Average Share of Primary Care Spend with Assigned PCP | Average Number of PCPs Seen by Attributed Patients | |
|---|---|---|---|
| Top Decile ACOs | 52% | 76% | 2.47 |
| Bottom Decile ACOs | 37% | 72% | 2.62 |
8. Top decile ACOs have greater home health agency utilization rates and lower skilled nursing facility utilization rate than bottom decile ACOs; this trend may indicate that top decile ACOs provide more effective and appropriate post-acute care based on patient need and acuity than other ACOs. Top decile ACOs admit 30% fewer patients to skilled nursing facilities per 1,000 patients than bottom decile ACOs. They’re also slightly more likely to use home health visits; top decile ACOs’ patients utilize home health visits 5% more than bottom decile ACOs’ patients.
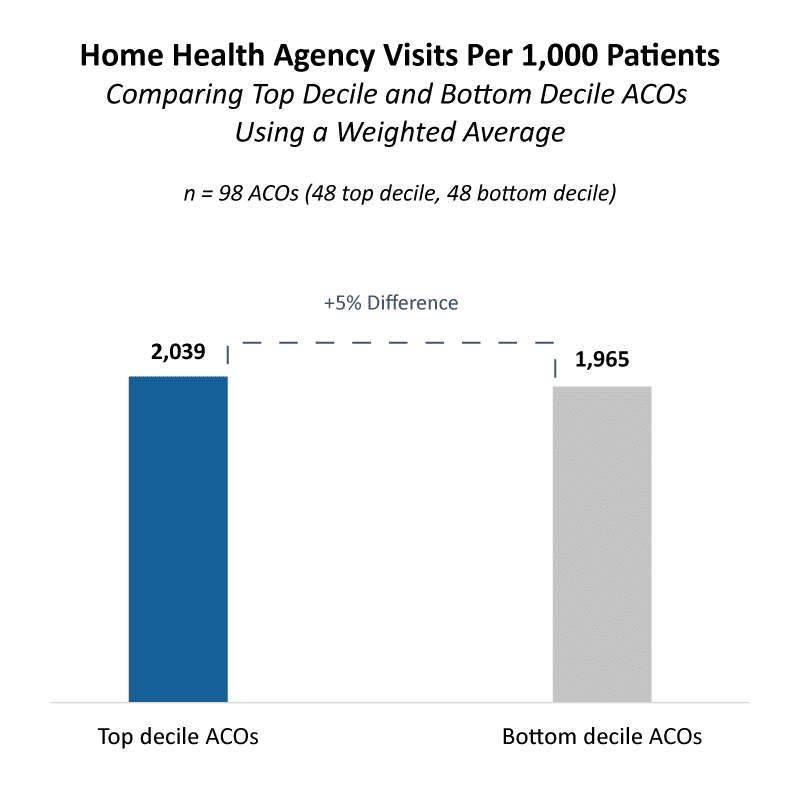
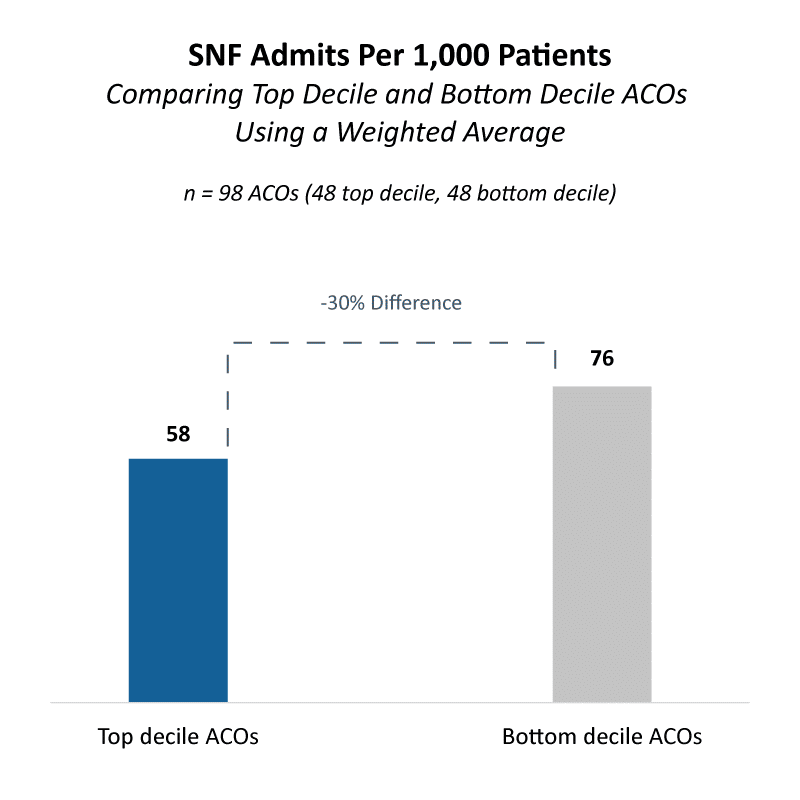
Spend data also demonstrates that top decile ACOs utilize home health agencies more than bottom decile ACOs. Top decile ACOs spend 4.7% of their total PMPY spend on home health agencies while bottom decile ACOs spend 3.9%. In addition, top decile ACOs spend less on skilled nursing facilities (SNFs): Top decile ACOs spend 6.4% of Total PMPY on SNFs while bottom decile ACOs spend 7%.
Conclusion
Top decile ACOs differ from low decile ACOs for many reasons, including spend breakdowns, better-performing TINs, ACO structure (TINs, beneficiary counts, number of providers), greater risk scores, primary care and post-acute strategies. Many of the metrics and analyses utilized in this analysis are available through value-based care data analytics partners.
Methodology
- Data Sources
- 2022 MSSP PUF File
- Risk Management APM Reports: ACO and Practice Groups
- VBC Entity Comparison Report
- Methodology
- Top decile is defined as the top 10% of ACOs according to their overall savings rate. Savings rate is defined as “Total Benchmark Expenditures Minus Assigned Beneficiary Expenditures as a percent of Total Benchmark Expenditures.” 48 ACOs make up the top decile.
- Bottom decile defined as the bottom 10% of ACOs according to their overall savings rate. Savings rate is defined as “Total Benchmark Expenditures Minus Assigned Beneficiary Expenditures as a percent of Total Benchmark Expenditures.” 48 ACOs make up the bottom decile.
- Weighted averages are calculated using member months from the VBC Entity Comparison Report.
- Risk-adjusted is calculated using normalized HCC
How CareJourney Can Help Get You Started
A 9-year veteran in the value-based care industry, CareJourney helps 150+ innovative VBOs grow their entities, improve care quality, and reduce costs using the most robust, detailed, comprehensive claims dataset available across Medicare, Medicaid, Medicare Advantage and Commercial data.
Organizations achieving success in risk-based programs trust CareJourney insights to guide their strategy and operations across six specific areas that directly correlate with either increased revenue, cost reduction, or quality improvement.

