Introduction
Accountable Care Organizations (ACOs) and the Centers for Medicare & Medicaid Services (CMS) used Hierarchical Condition Categories (HCCs) for many years. With the increased participation of providers in advanced payment models, ACO leaders now require innovative analytics on HCC prevalence among the Medicare Fee-for-Service population. In partnership with CareJourney, Rush University Medical Center (RUMC) sought to measure overall HCC prevalence and develop a set of benchmarks to inform value-based care initiatives within their own organization. CareJourney and RUMC developed these analytics from a national Medicare Fee-for-Service claims data set that can also be used by healthcare providers across the country for population health management. The analytics included a HCC benchmarking calculator that evaluates an ACO’s population medical complexity through HCC profiles and compares that profile against other ACOs to understand differences in populations. Continue reading for some of the highlights from the data and how HCC benchmarking can drive population health insights or value-based care performance.
Background
In value based programs such as the Medicare Shared Savings Program (MSSP), expenditures for patients are benchmarked and risk adjusted based on the medical complexity of the patient. Since 2004, CMS gauged a patient’s medical complexity with HCCs. HCCs evolved through the 21st Century Cures Act and are now the workhorse measurement of medical complexity for population health and value-based performance.
HCCs succinctly capture patient medical complexity as providers submit qualifying diagnoses on professional, inpatient, and outpatient claims. These diagnosis codes are categorized into groups that describe the medical condition, and then some are further organized into hierarchical condition categories that indicate levels of severity. Some examples of the condition categories include vascular disease, diabetes, and chronic heart failure, with higher risk scores assigned to conditions with chronic or acute complication. Each HCC is also assigned a risk-adjustment factor (RAF) weight based on its relationship to driving increased medical expenditure. In general, the HCC methodology will assign higher risk scores for patients with higher medical complexity.
In the context of Medicare Advantage, CMS uses these scores, in aggregate, to determine Medicare Advantage capitation rates. In MSSP, HCCs influence benchmark expenditure. HCC analytics through the ACO lens can guide ACOs through their population health management initiatives, ensuring their patients are getting the appropriate level of care. Within the general Medicare Fee-for-Service environment, HCC analytics can also support various initiatives that require an understanding of a new population’s health, such as expansion into a new market.
See National HCC Trends Across All ACOs.
Go to our free data dashboard to see HCCs ranked by national prevalence and opportunity.
How Does Your ACO Compare?
See your most & least prevalent HCCs, recapture rates, and the impact of v28 risk adjustment methodology on your population.
Methodology
RUMC and CareJourney utilized the national Medicare Fee-for-Service claims database to establish the foundation for national benchmarking. First, the base population prevalence of medical conditions aligned to HCCs, measured as count per 1,000 members, form the initial benchmark of medical complexity for an ACO’s population. Given known variability in patient visit patterns and medical documentation practices, an additional analysis was completed to gauge the recapture rate of medical conditions by evaluating claims from the prior year. Patient diagnoses aligned to HCCs submitted on claims in the prior year (year 1) that were not submitted on claims in the most recent year (year 2) are considered medical conditions that were not recaptured. A maximum population medical complexity by HCCs was estimated by adding the medical conditions that were not recaptured to the most recent year prevalence. These metrics can be calculated by ACO Revenue Type (High/Low), HCC category, HCC type (chronic/acute), and ACO. HCC capture from a clinical documentation or coding perspective is outside the scope of this data.
Findings
With 86 HCC codes and thousands of ICD-10 codes that map to these categories, the RUMC analytics team wanted to identify the most and least prevalent medical conditions, as represented by HCCs, present within their population. CareJourney’s data allowed the team to accomplish multiple goals:
- Validate assumptions about the medical complexity of the Rush patient population, as compared to national benchmarks
- Identify medical conditions, such as vascular complications, that required deeper investigation to understand variability in clinical diagnosis over time, as evidenced by low recapture rates
- Establish benchmarks for long-term medical complexity trending
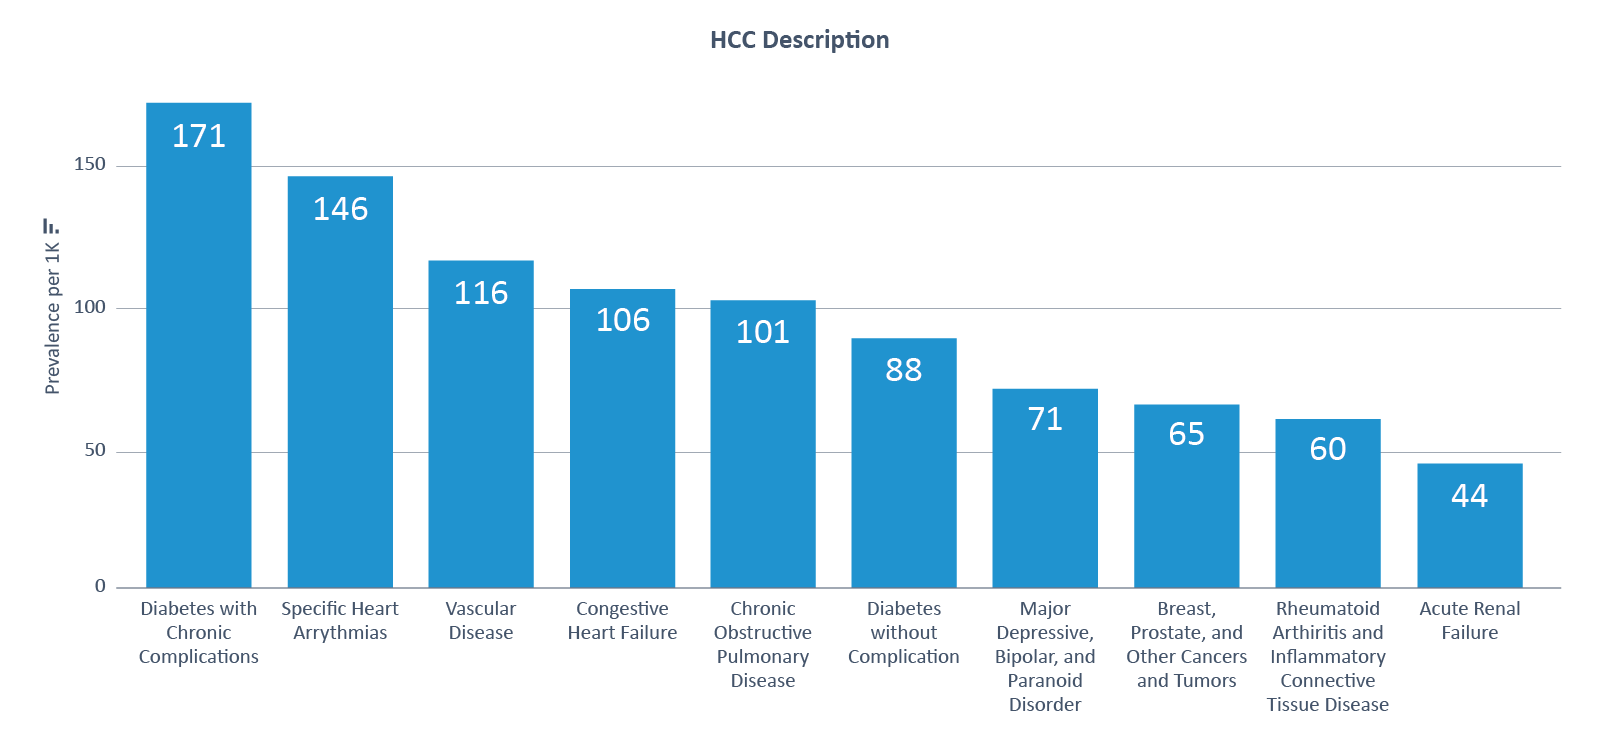
Applying these analytics to a national lens, CareJourney identified the most prevalent medical conditions by HCCs, which tended to be chronic conditions related to diabetes and cardiac disease (see Figure 1).
Figure 1: Top 10 HCCs by Prevalence

Extending the analysis to recapture rate among medical diagnoses, CareJourney looked within chronic conditions to find the most and least consistently recaptured HCCs. Due to low recapture rates, a few HCCs stand out as opportunities for understanding variability in clinical diagnoses: Traumatic Amputations, Vascular Disease, Hemiplegia/Hemiparesis, Chronic Pancreatitis, Coagulation Defect, and Chronic Hepatitis.
Figure 2: Lowest 10 Chronic HCCs by Recapture Rate

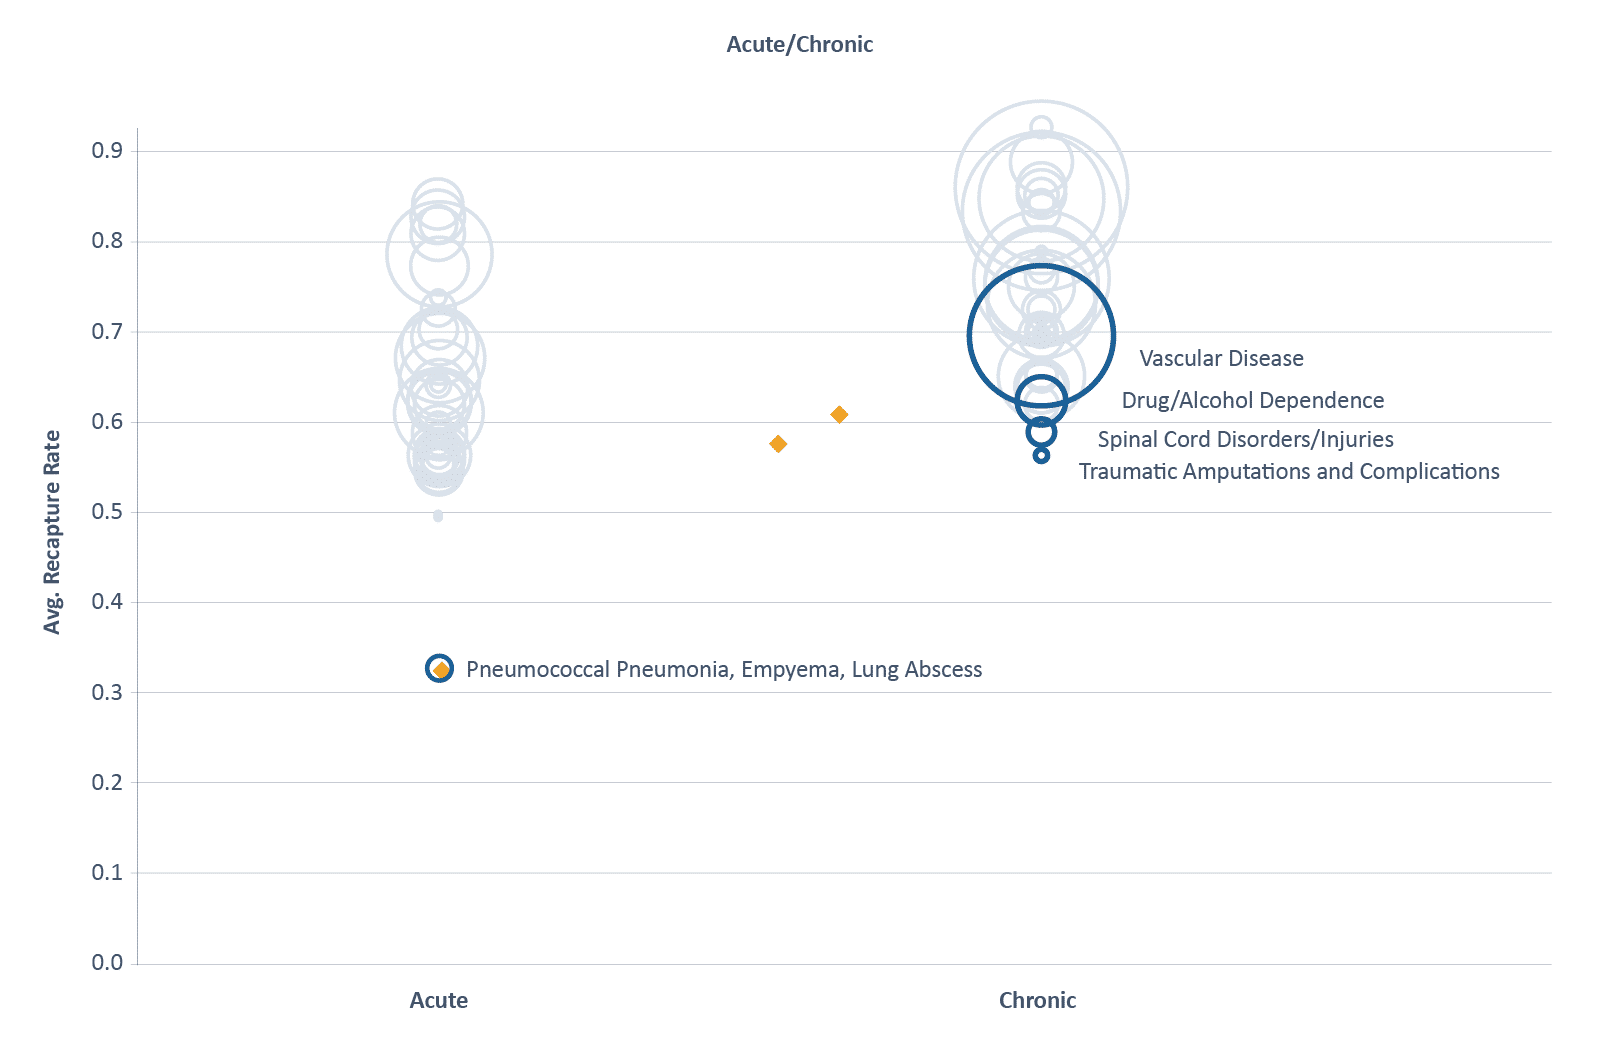
Figure 3 summarizes the national distribution of prevalence and recapture rates across acute and chronic HCCs. The size of the bubbles are scaled to prevalence, with larger bubbles for medical conditions with higher population prevalence. Bubbles closer to the bottom represent medical conditions with low rates of recapture from one year to the next. Medical conditions with a large bubble closer to the bottom are candidates for further analysis in clinical diagnosis patterns.
Figure 3: HCC Prevalence and Recapture Rates

On average, CareJourney observed a higher rate of recapture for medical conditions HCCs deemed to be chronic versus acute. Recapture rates for acute HCCs may naturally tend to be lower as patients recover from these conditions over time. Recapture rates of chronic HCCs present more tangible opportunities for benchmarking over time. On the lower end of the Chronic graph, we’ve highlighted the conditions that were recaptured at the lowest frequency. Vascular Disease stood out as a highly prevalent HCC with lower recapture rates across all ACOs.
Other Use Cases
In addition to the initiatives that RUMC and CareJourney pursued, analysis of prevalence and recapture rates of HCCs can be incorporated into compliant documentation and coding improvement initiatives to ensure a patient’s true medical complexity is accurately represented in medical claims. ACOs can also use medical complexity benchmarking to ensure that value based expenditure benchmarks accurately reflect the patient population being served. CMS sets medical complexity based on services rendered the prior year, so consistent monitoring and education on medical complexity and HCCs are necessary to ensure ACOs receive the appropriate credit for the medical complexity of their patient population year-over-year.
Explore with CareJourney
Benchmarking at the national level is a helpful starting point. More actionable data are unlocked when specified for ACOs to evaluate performance across HCCs and identify opportunity within a targeted patient population. By working with CareJourney, ACOs can obtain a detailed workbook that highlights the ACO’s prevalence of medical conditions and compares recapture rates against other ACOs.
After identifying a few focus areas through our analytics, organizations can further investigate potential variability in clinical diagnosis and documentation practices within their ACO, resulting in a more accurate representation of medical complexity. If you would like a fresh look at your HCCs, please contact CareJourney.
