
By Ben Bigelow
The ecosystem of healthcare data is vast. There are electronic health records (EHRs), medical claims, lab results, biometrics, and a whole slew of other data sources, including open data published by organizations like the Center for Medicare and Medicaid Services (CMS).
At CareJourney, we specialize in using open data to augment our members’ data and providing them with a better picture of their performance. The CMS performance results for the Medicare Shared Savings Program (MSSP) are an important starting point for understanding how ACOs reduce spending and make savings.
Build and Optimize Networks of Care with Network Advantage
REQUEST A DEMO
Last October, the Center for Medicaid and Medicare Services (CMS) released the 2016 results for the Medicare Shared Savings Program (MSSP). In the wake of the release, there were plenty of articles focusing on aggregate trends in the program and, in particular, factors associated with ACO success. Physician-led ACOs trumped hospital-led ACOs, risk-takers outperformed the risk-averse, and a high benchmark helped more than it hurt.
But each ACO is different and can achieve savings in different ways. To understand individual ACO performance, we combined data from the 2015 and 2016 MSSP results public use files (PUFs), including only ACOs that participated in both years for a total of 332 ACOs. We then calculated the absolute and relative changes in benchmarks, expenditures, beneficiaries, and other key metrics to create the CareJourney Open Data Report.
The ways in which ACOs changed varied widely among organizations. Take Hackensack Alliance, for example. Hackensack Alliance made savings in both years, and it primarily reduced spending on post-acute services: skilled nursing facility (SNF) spending fell by 13.3% and home health spending fell by 6.5%. However, spending on outpatient and short-term acute care rose by 14.1% and 3.4%, respectively.
Benchmarking ACO Performance
To benchmark individual ACO performance, we created five benchmark groups. First, we considered changes in key spending and utilization metrics across all ACOs. We also separated ACOs into four additional benchmark groups: those that shared savings in both years (76 ACOs, 23%); those that only shared savings in 2015 (31 ACOs, 9%); those that only shared savings in 2016 (40 ACOs, 12%); and those that didn’t share savings in either year (185, 56%).
As mentioned above, Hackensack Alliance saw outpatient spending increase by $289 PMPY and SNF spending decrease by $204 PMPY from 2015 to 2016. Both of these changes were significantly different from the median change across all ACOs. In this benchmark group, the median drop in SNF spending was $68 PMPY; the median change in outpatient spending, however, was only $57 PMPY.
Further Analysis
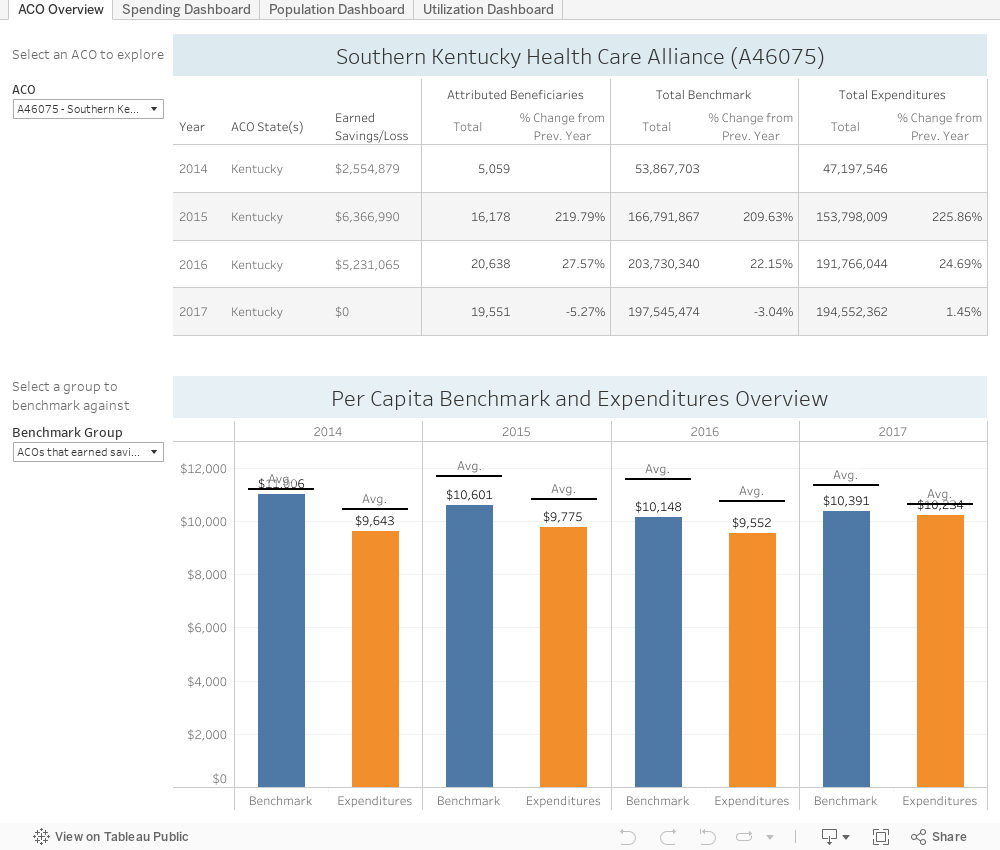
If you’d like to explore how another ACO’s performance changed over time or how it changed relative to other benchmark groups, check out our custom analysis in Tableau. You can analyze trends in spending, inpatient discharges, emergency room visits, and other areas of interest.
Build and Optimize Networks of Care with Network Advantage
REQUEST A DEMO