CareJourney – The Industry’s Leading Analytic Workbench for CMOs
CareJourney – The Industry’s Leading Analytic Workbench for CMOs
With interactive dashboards tracking care model compliance and ROI by patient segment, “bottoms-up” views of PMPY trends, post-acute performance, network leakage, and much more available at the doctor, facility, and patient-level, Insights Online focuses on actionable, clinically-relevant insights to improve quality and reduce cost.
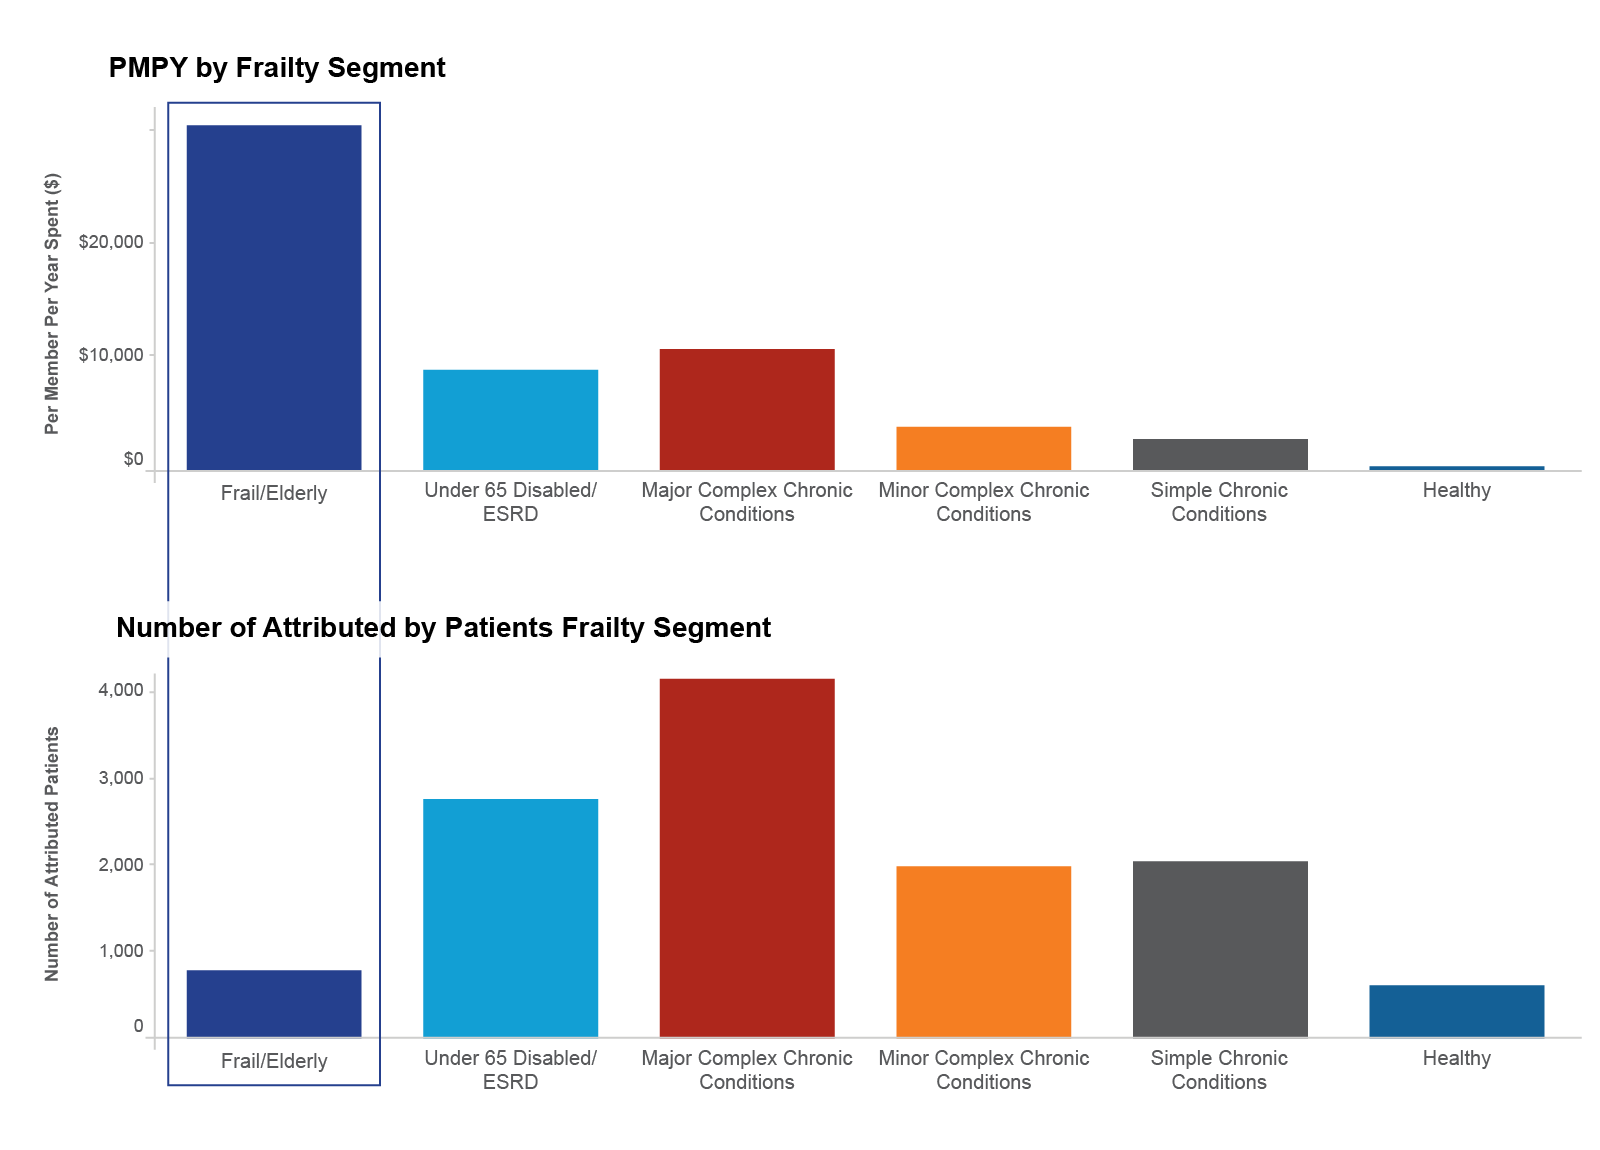
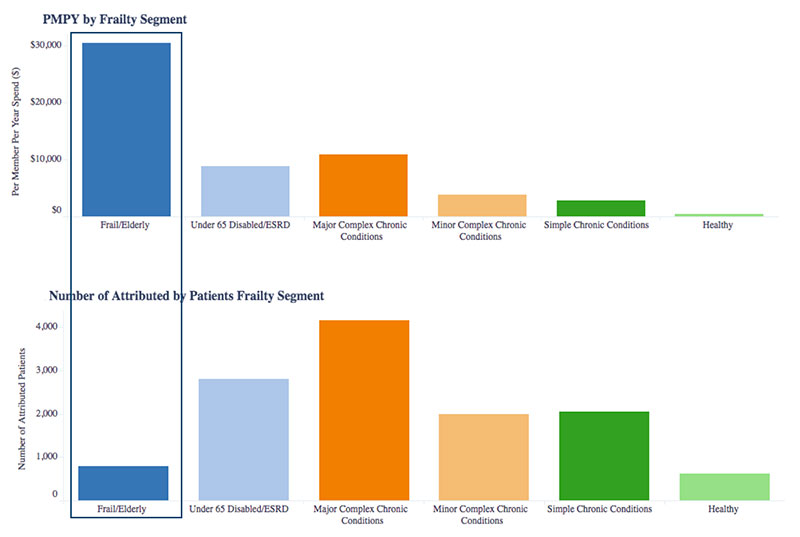
Spend by Patient Risk Segment
Consistent with national research, the frail elderly population accounts for a disproportionate share of cost for our member ACOs
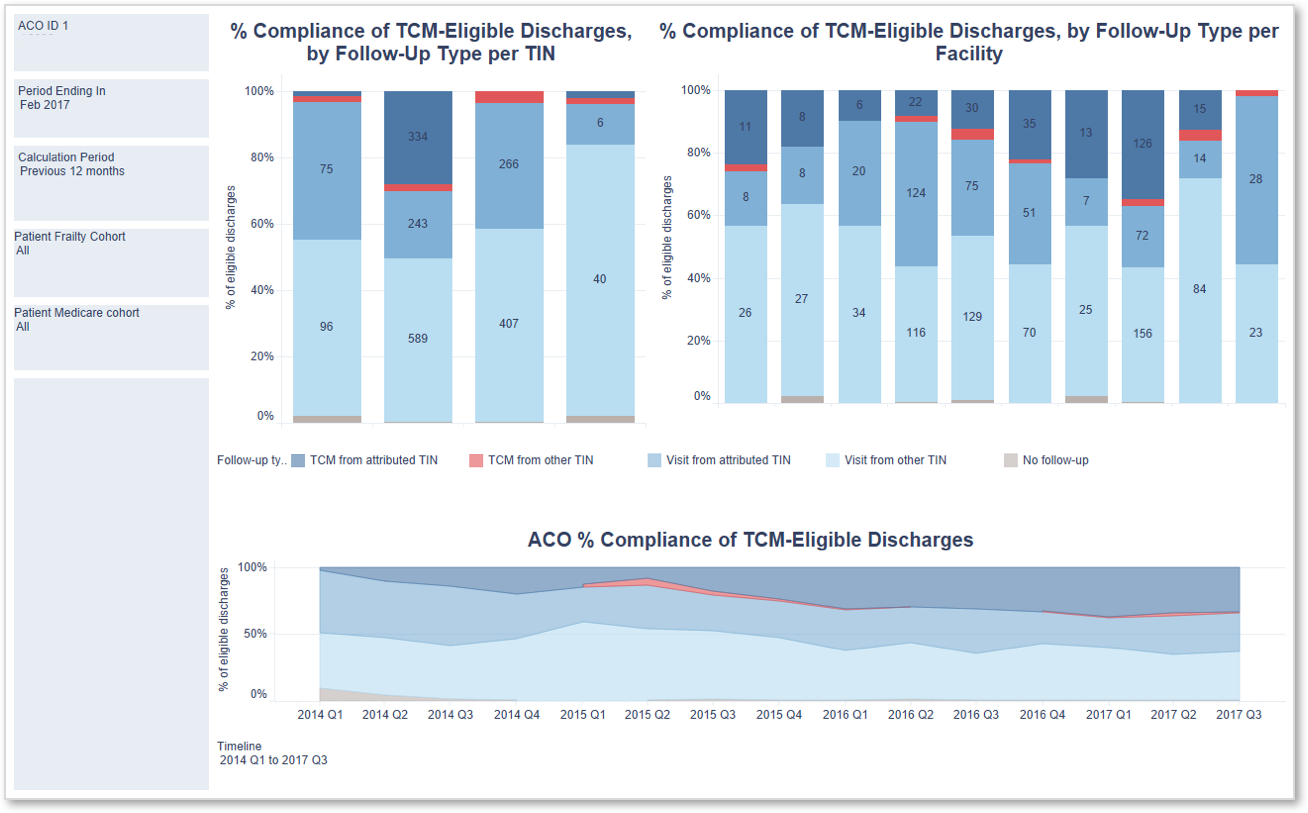
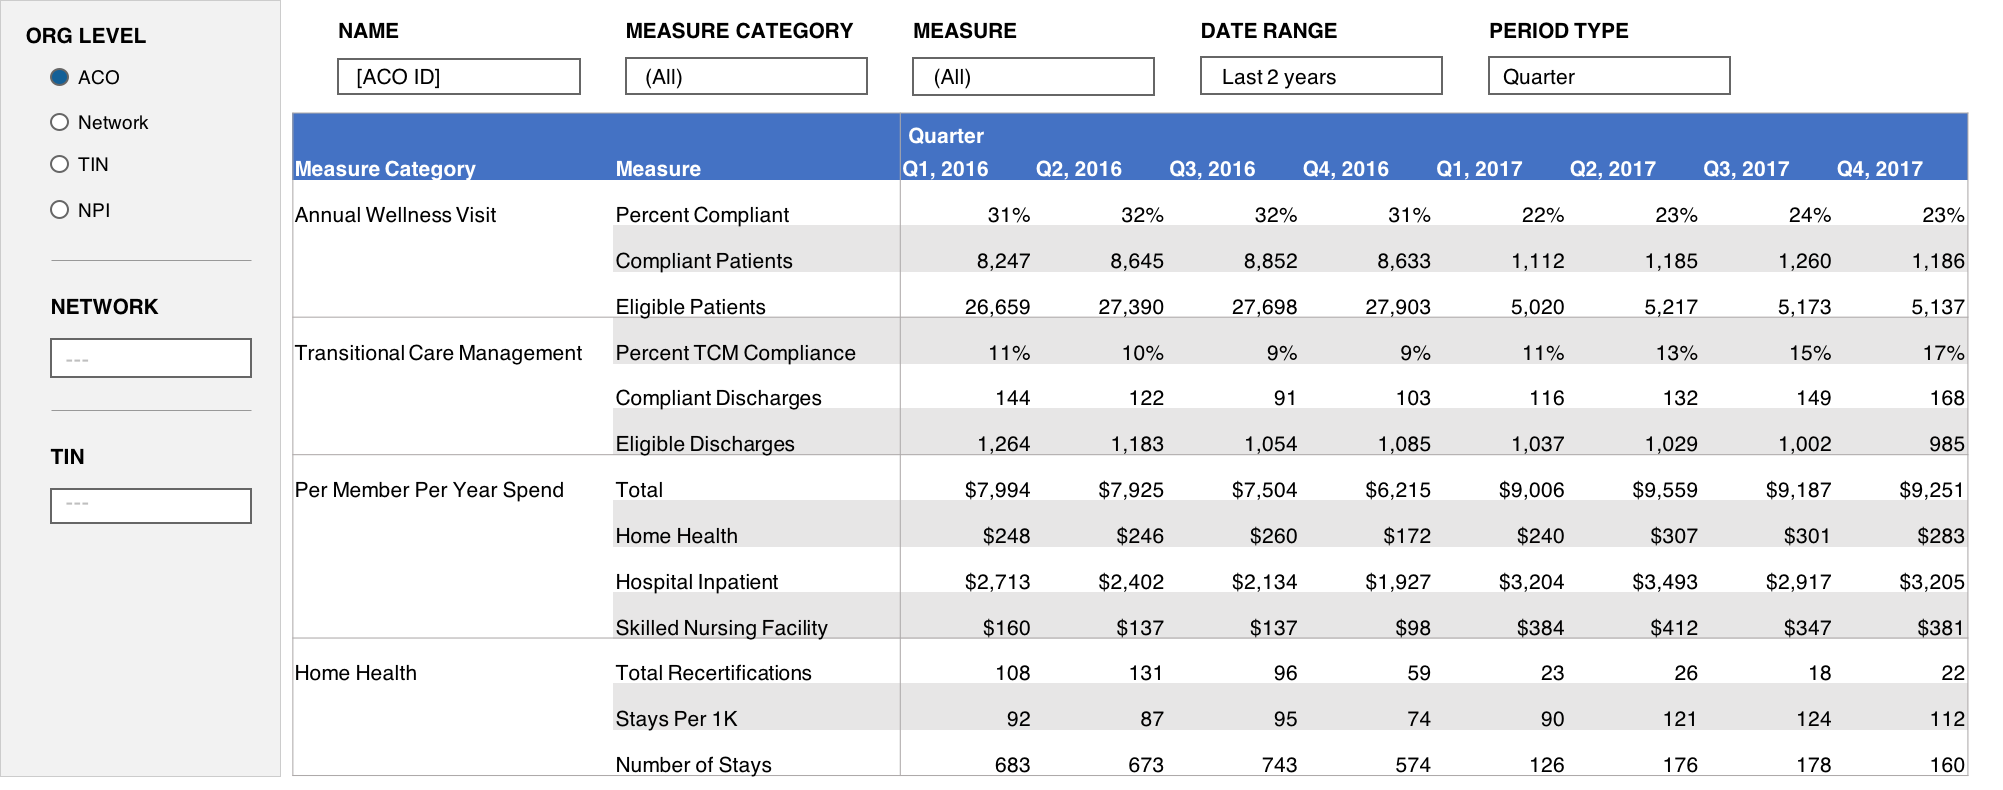
Sample Care Model Dashboard – Transitional Care Management
Drill into follow-up with TCM-eligible patients by TIN, facility and patient cohort
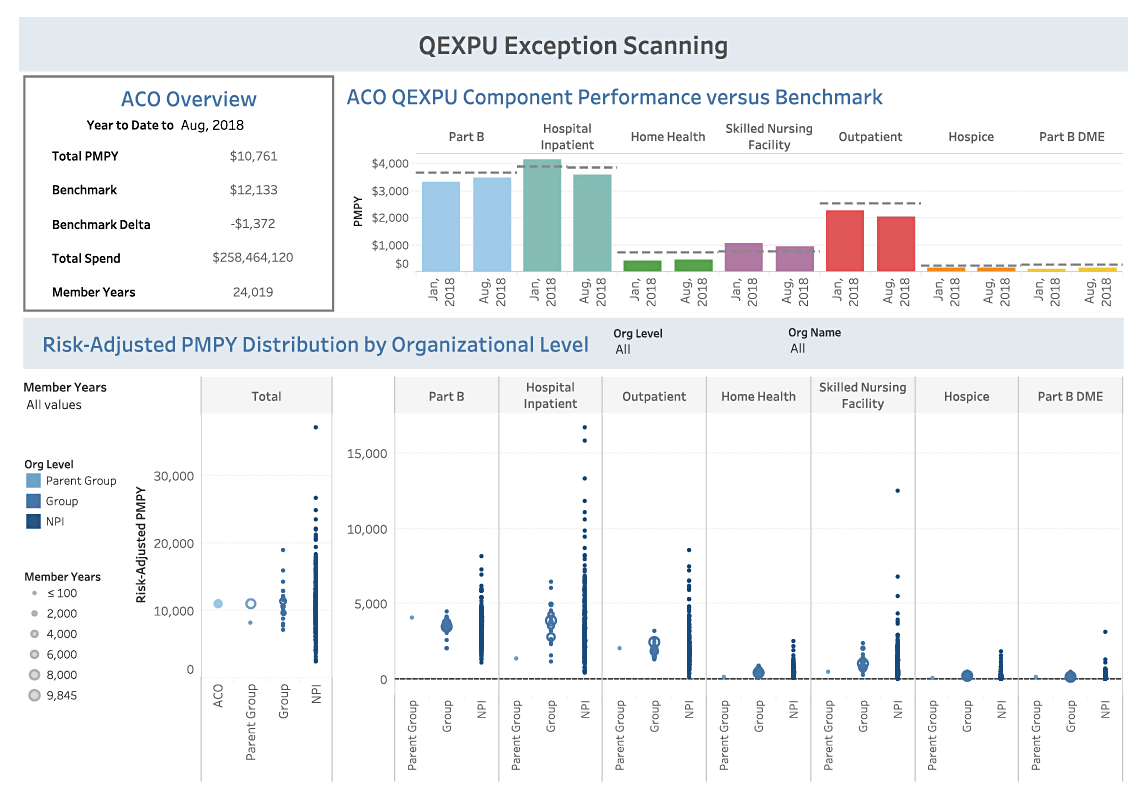
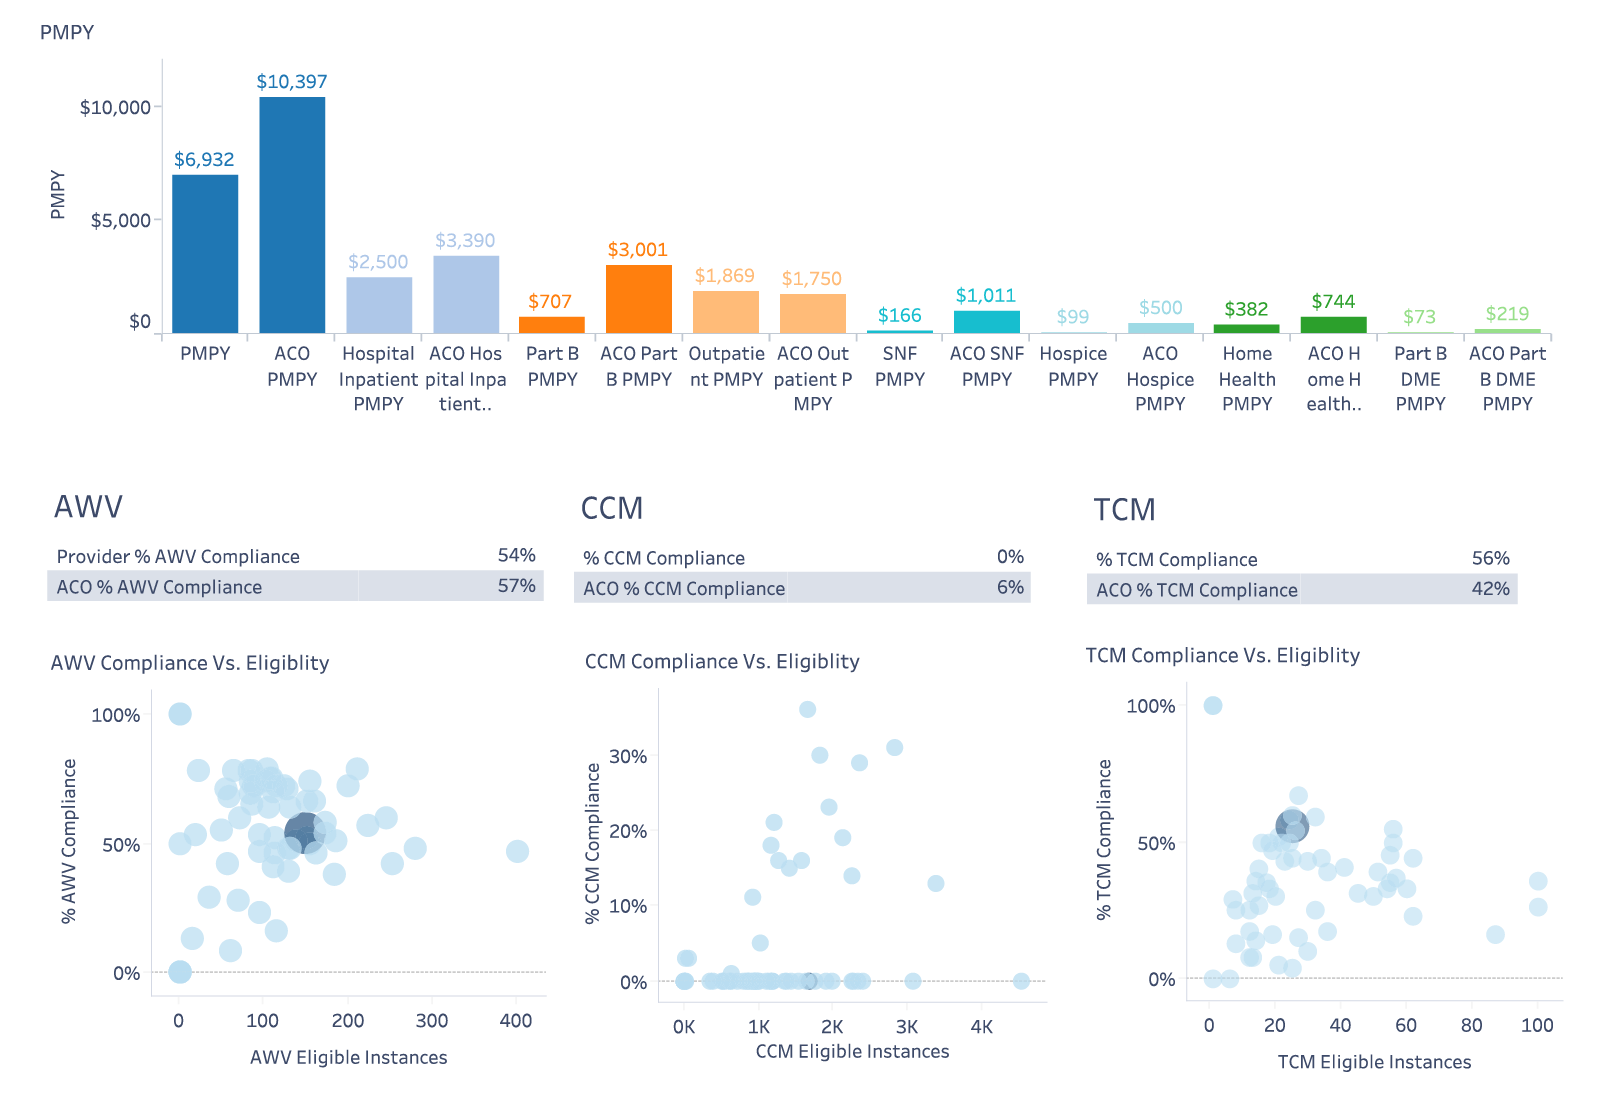
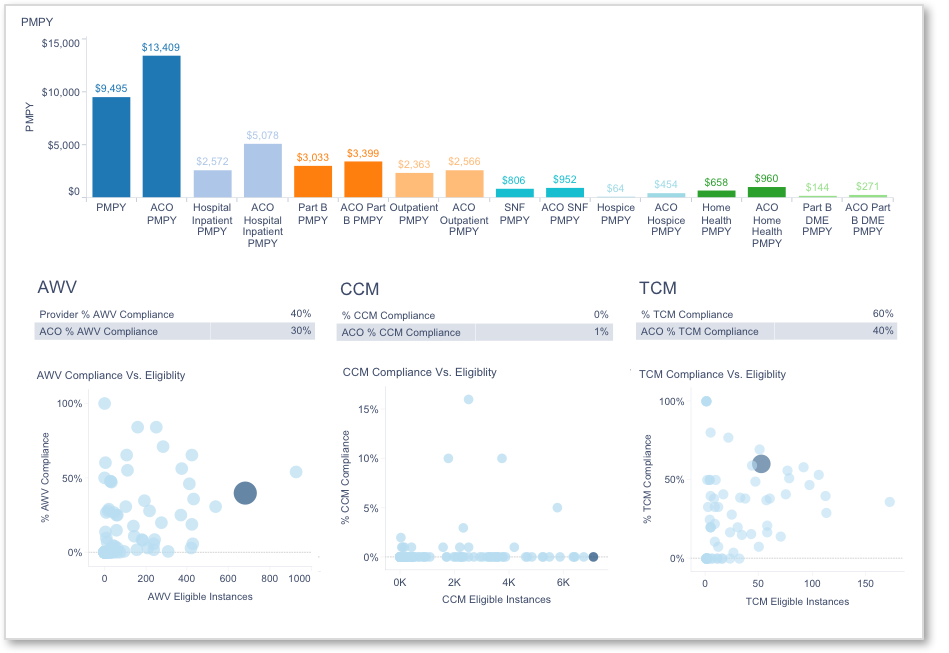
PMPY Insights and Exception Scanning
View PMPY by expenditure type with insight into year over year trends, outliers, and performance above or below benchmark – all at the doctor, practice, network and ACO level

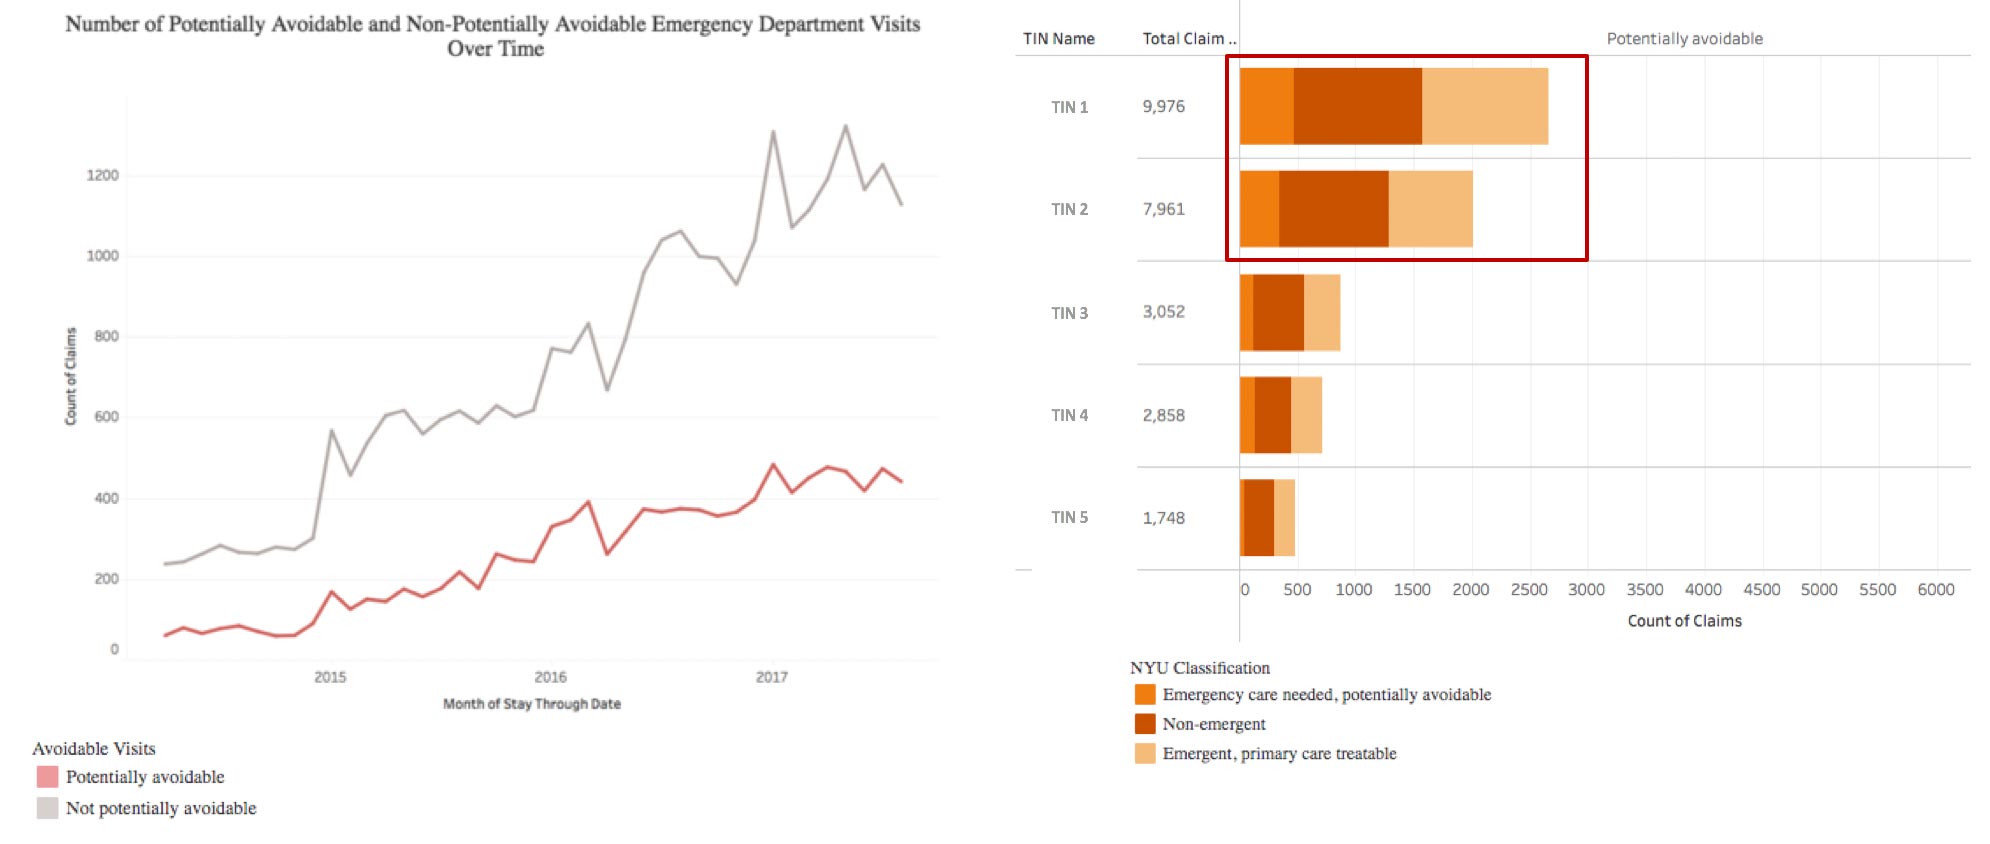
Avoidable Emergency
CareJourney tracks potentially avoidable ED visits using a modified version of the NYU algorithm based on research by Harvard Professor Ashish Jha; examine overall trends in ED visits and investigate at the TIN or NPI level.
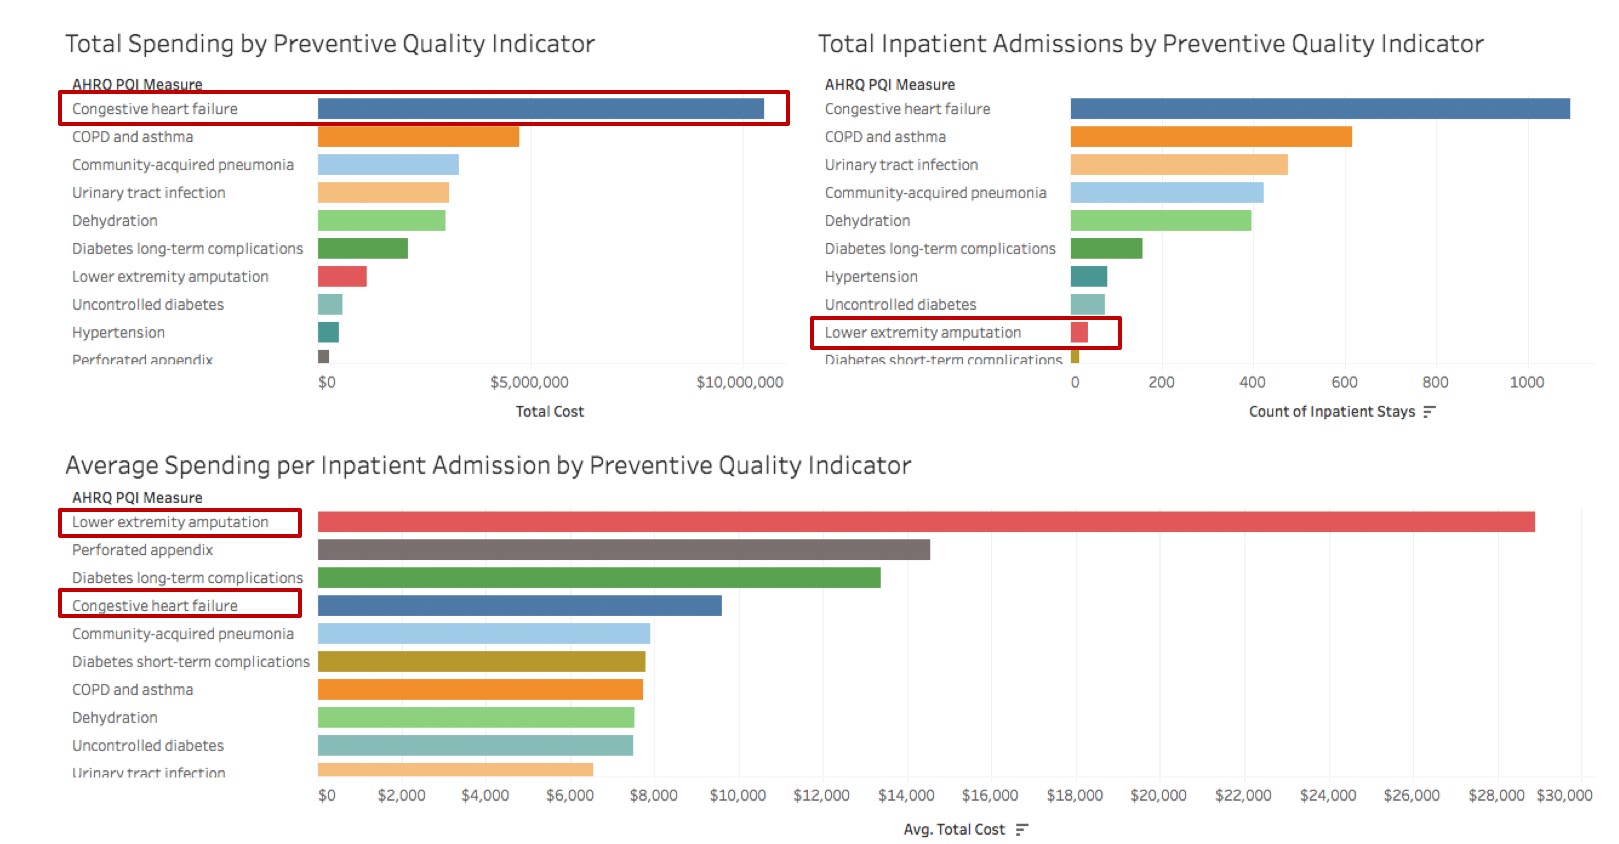
Impactable Admissions
CareJourney has implemented the logic for AHRQ’s PQI measures, allowing users to track preventable spending and admissions.
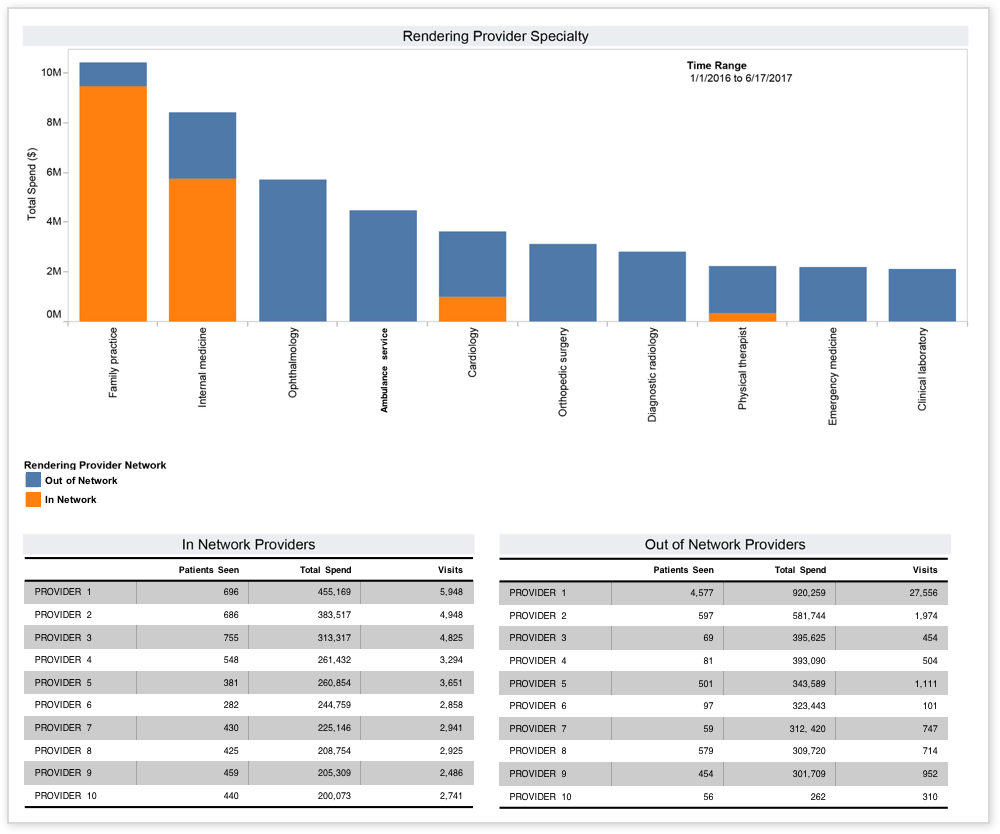
Network Utilization Dashboard
Segment spend by in- and out-of-network providers to track leakage and identify gaps in coverage
Sample Profile List – Facilities
View key performance metrics from claims and open data on every facility which treats attributed patients

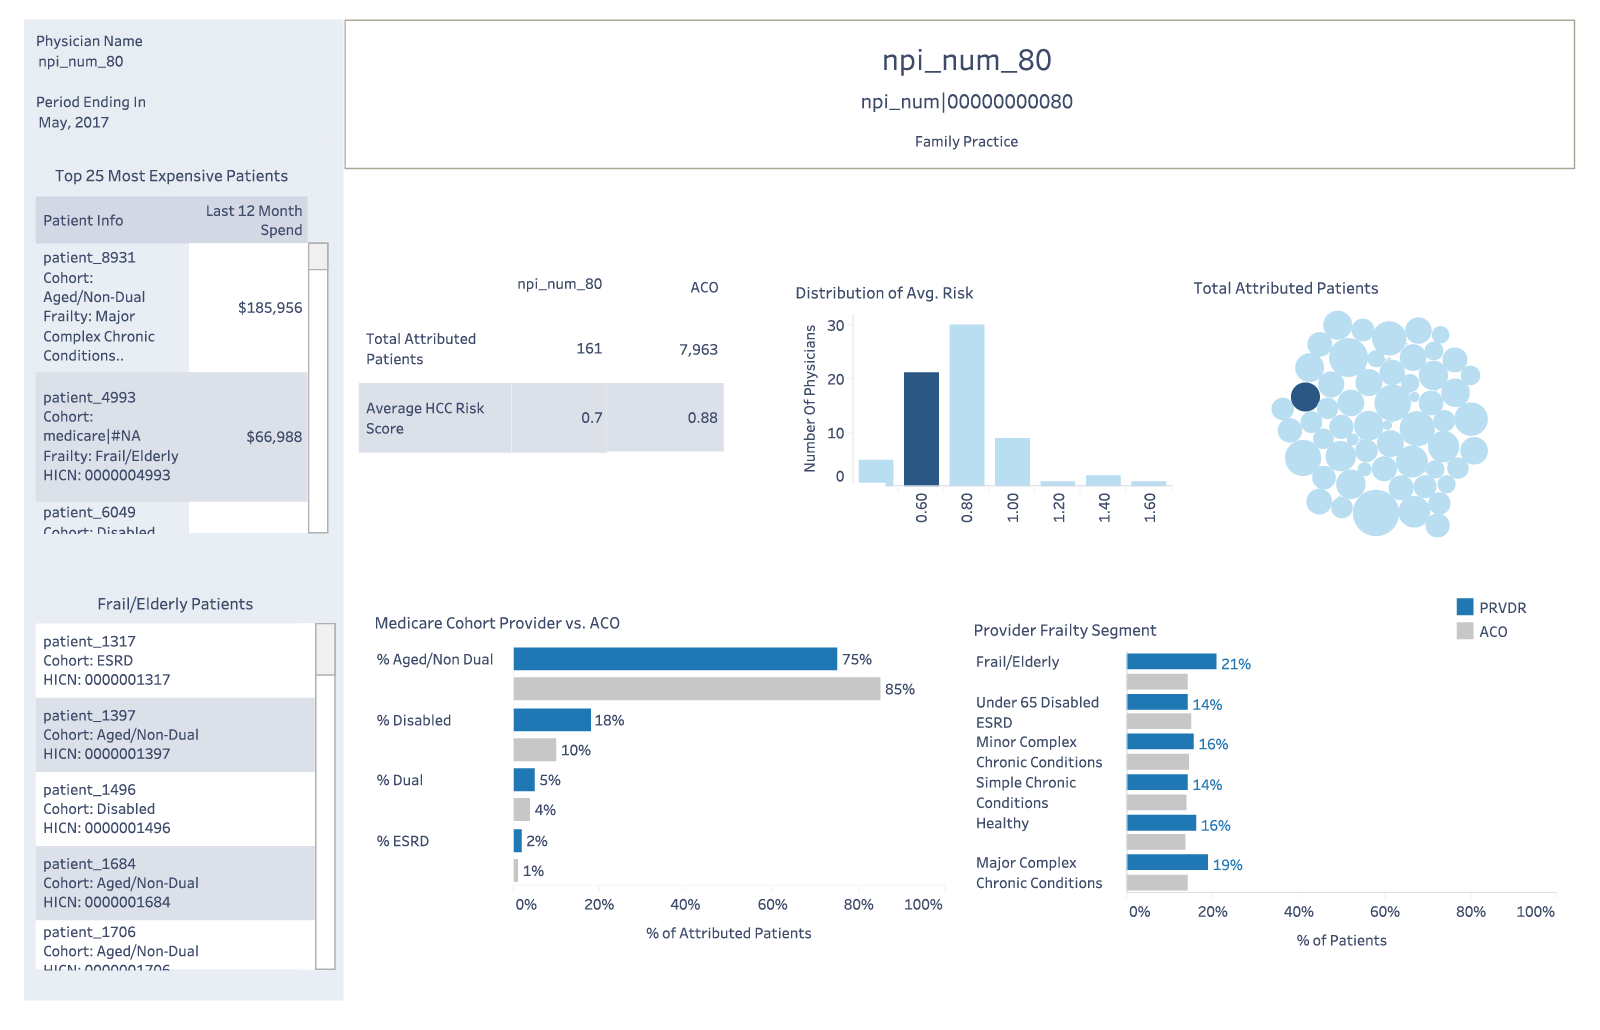
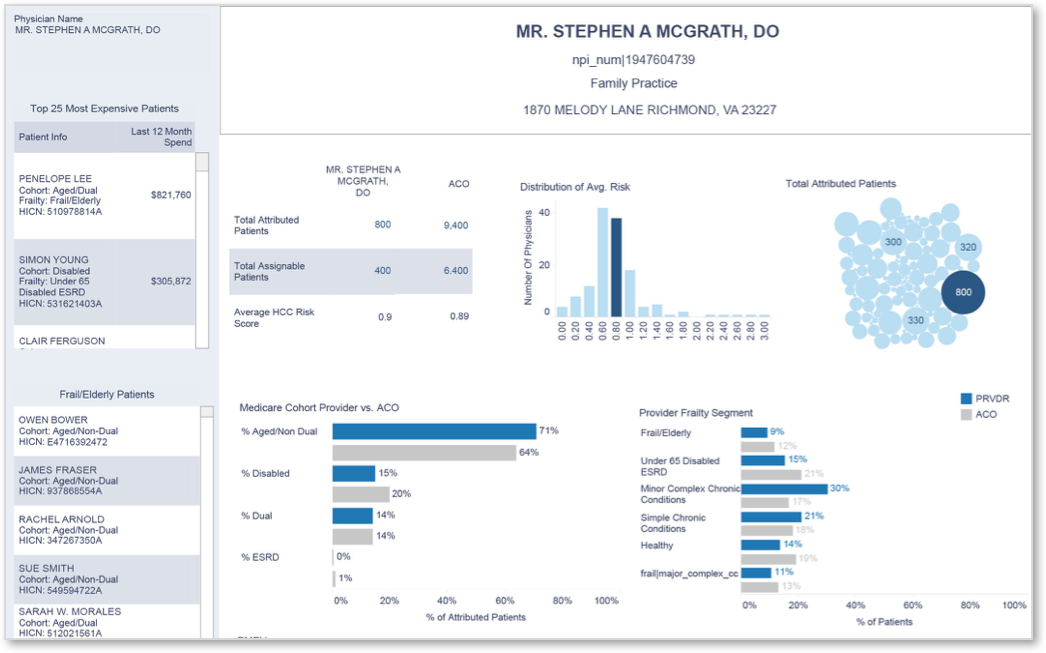
Physician Scorecard
View each physician’s critical performance metrics as well as their high-cost, high-risk patients
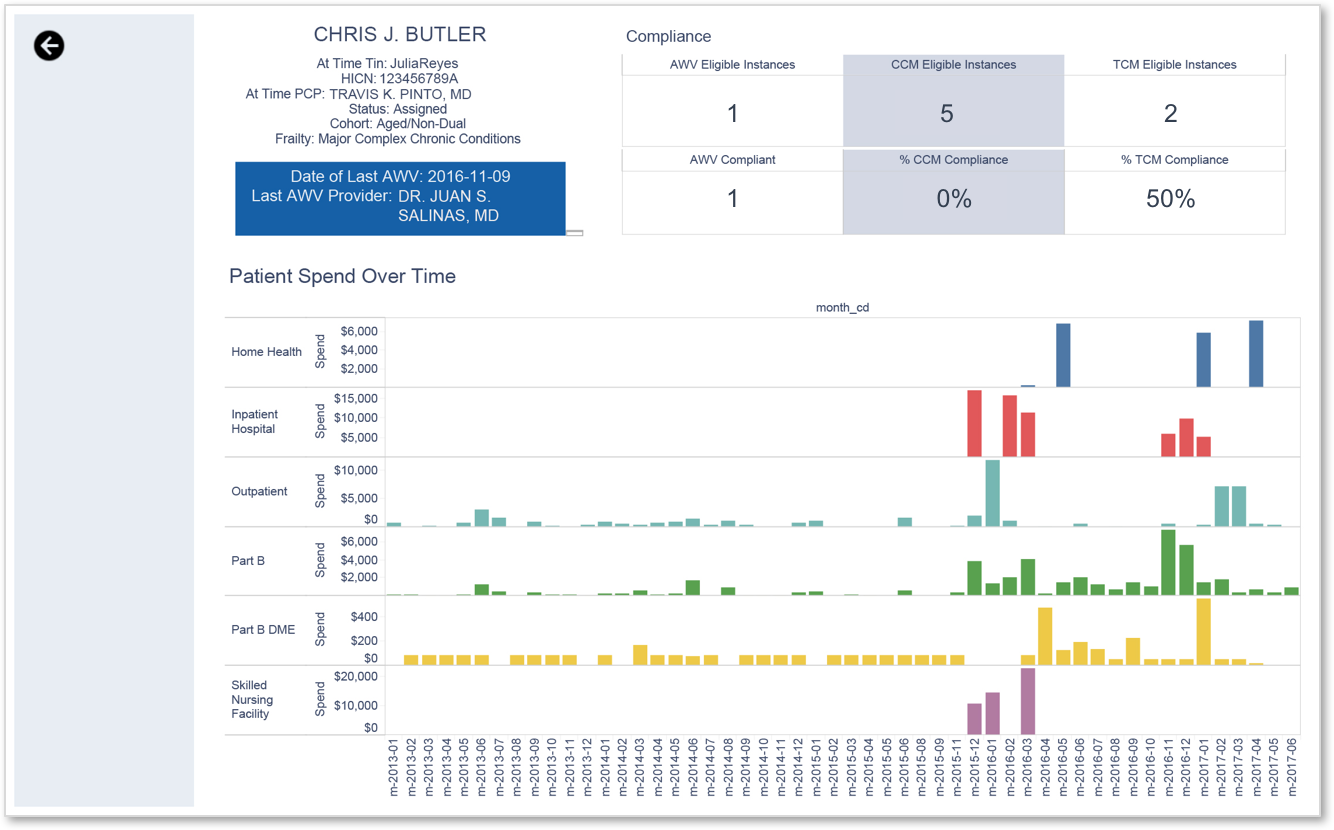
Patient Profile
Gain visibility into a patient’s necessary care compliance and component expenditure over time
Operational Dashboard
Track key performance metrics annually, quarterly, and monthly at the ACO, network, TIN, and NPI levels across care models and utilization
Data is for illustrative purposes only and does not represent real ACOs, provider groups, facilities, physicians, or patients.
Create Meaningful Risk Segments
Spend by Patient Risk Segment
Consistent with national research, the frail elderly population accounts for a disproportionate share of cost for our member ACOs
Track and Measure High-ROI Care Models
Sample Care Model Dashboard – Transitional Care Management
Drill into follow-up with TCM-eligible patients by TIN, facility and patient cohort
Manage Utilization and Spend
Operational Dashboard
Track key performance metrics annually, quarterly, and monthly at the ACO, network, TIN, and NPI levels across care models and utilization
PMPY Overview
View PMPY by expenditure type with insight into year over year trends at the ACO, network, TIN, and NPI levels
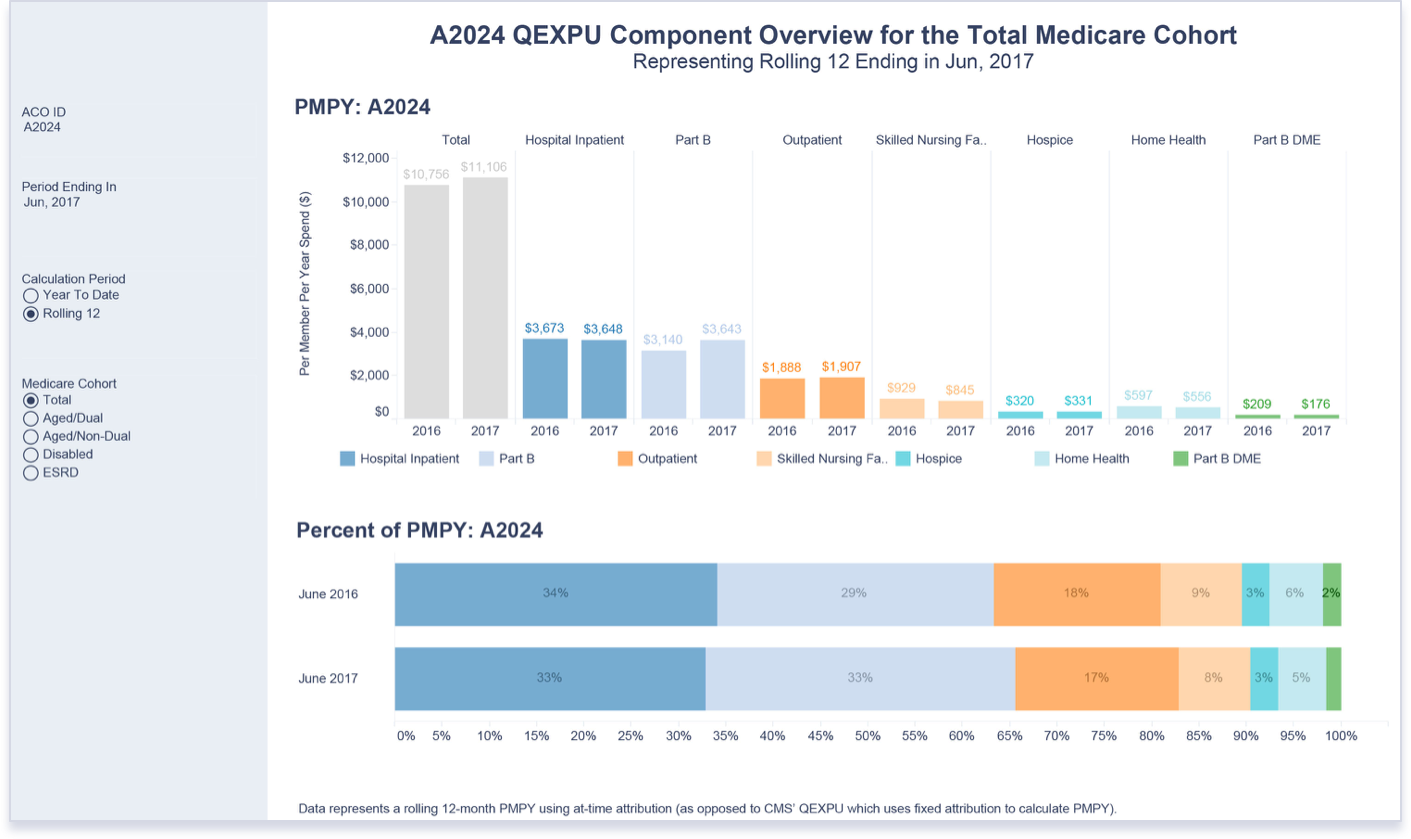
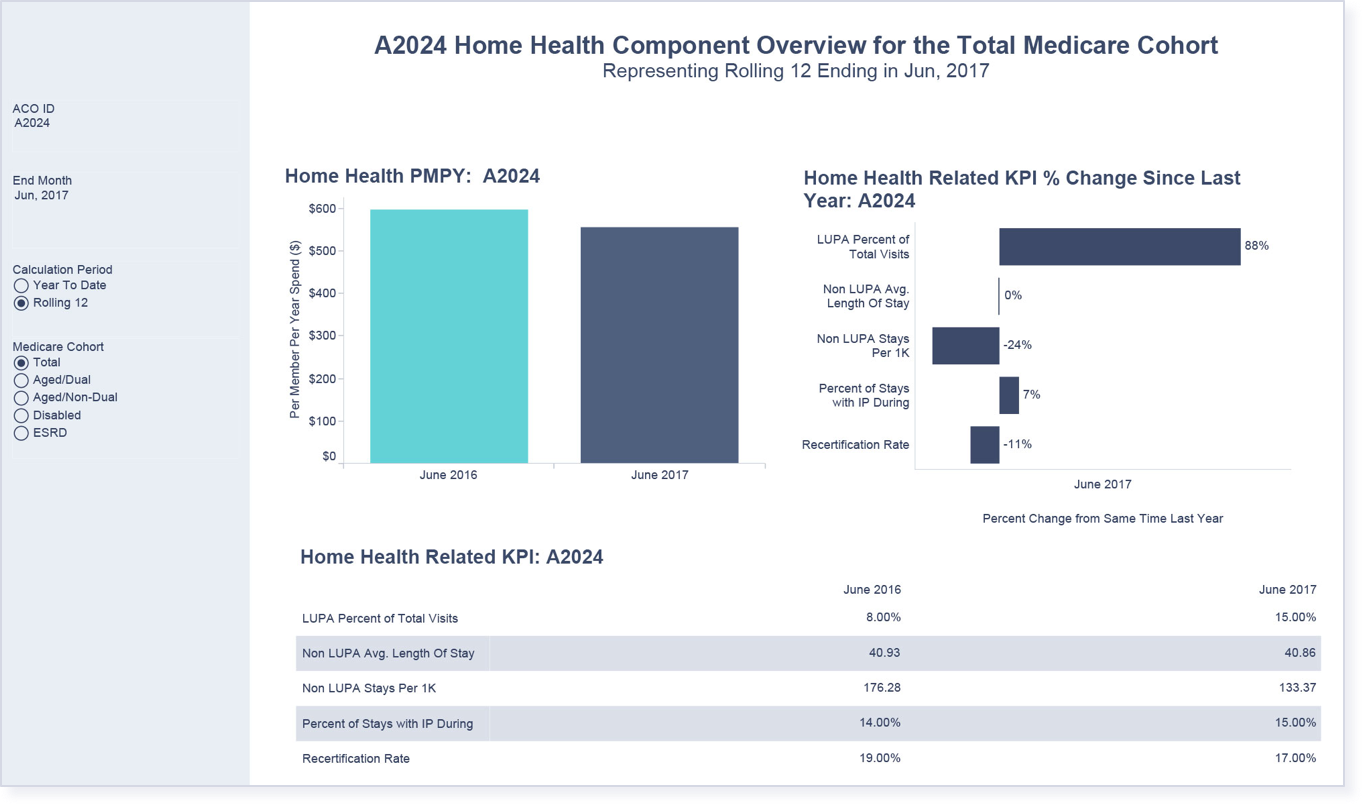
Component Overview
Dive deeper into component-specific PMPY and relevant KPIs
Build and Harness Your Network
Network Utilization Dashboard
Segment spend by in- and out-of-network providers to track leakage and identify gaps in coverage
Build and Harness Your Network
Network Utilization Dashboard
Segment spend by in- and out-of-network providers to track leakage and identify gaps in coverage
Drive Change with Actionable Lists
Sample Profile List
View key performance metrics from claims and open data on every facility which treats attributed patients

Physician Scorecard
View each physician’s critical performance metrics as well as their high-cost, high-risk patients
Patient Profile
Gain visibility into a patient’s necessary care compliance and component expenditure over time
With interactive dashboards tracking care model compliance and ROI by patient segment, “bottoms-up” views of PMPY trends, post-acute performance, network leakage, and much more available at the doctor, facility, and patient-level, CareJourney focuses on actionable, clinically-relevant insights to improve quality and reduce cost.
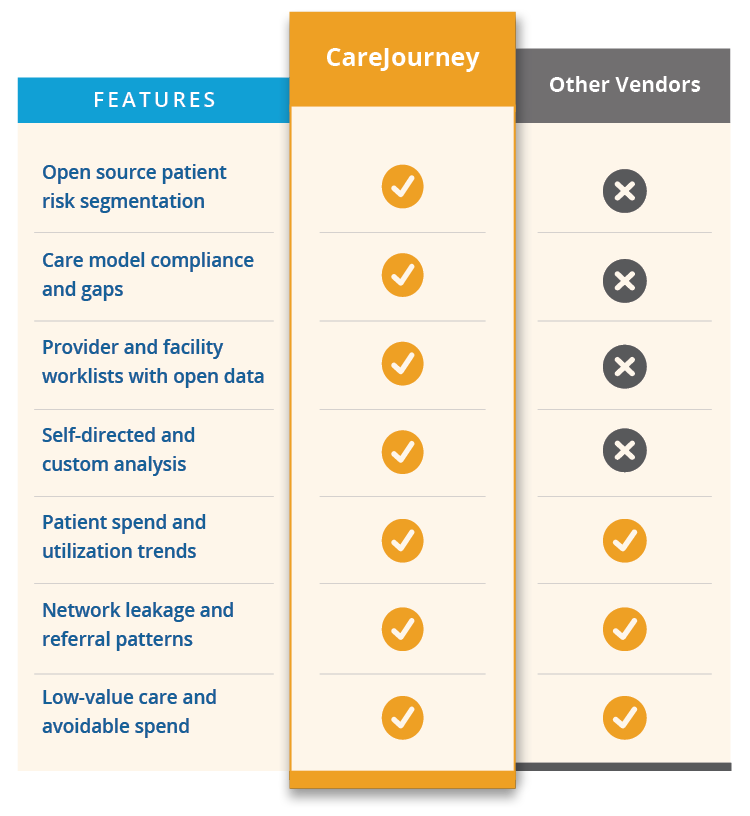
Competitor Comparison