Background
While much of the healthcare market hypes Open Enrollment (OE), for CareJourney, the months to follow are an equally exciting time. During OE, the Centers for Medicare and Medicaid (CMS) and health plans are able to recruit new (and retain existing) Medicare Advantage (MA) insurance plan beneficiaries as individuals select their choices for the year.
These enrollment numbers are released from CMS as an open-data set on a monthly cadence. While the month over month data snapshots are interesting by themselves, in comparing December 2019 to January 2020 enrollment numbers, we see more than just standard beneficiary fluctuations. This comparison shows the fruits of labor of the various health plans across the OE period (for which new coverage begins in January 2020) and are a metric of success.
See How Your Region Fared: An Interactive Dashboard
Fill out the form to the right to view Medicare Advantage enrollment numbers by county, state, and plan, as well as learn our takeaways from the data.

What We Learned
This year, we saw several interesting data trends.
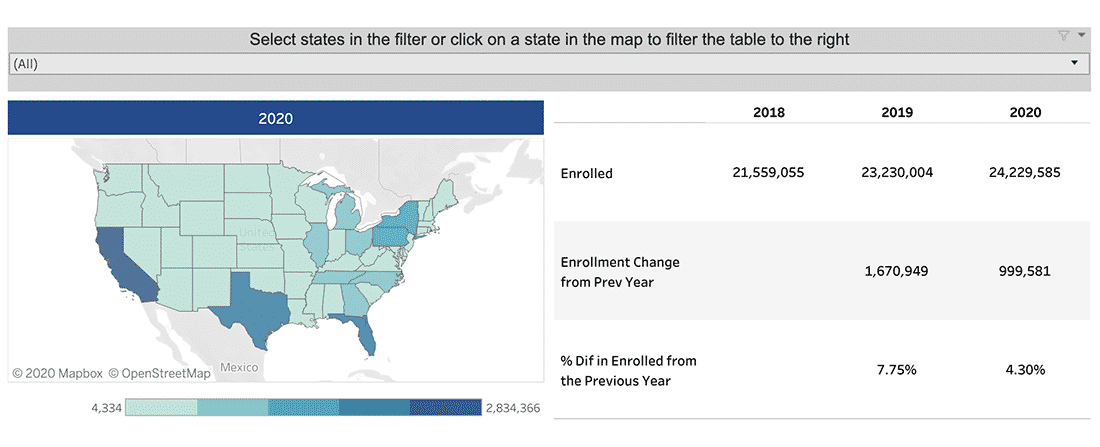
Nationally, the MA market grew during the OE period. Anecdotally, we had heard and experienced this with the emphasis around MA. However, to put numbers to the trend, in December 2019, MA enrollment stood at 23,230,004 beneficiaries. When comparing this to December 2018, this was an increase of 7.75%. With that strong growth in mind, it is no surprise that the overall MA market continued to expand to a level of 24,229,585 beneficiaries in January of 2020, representing a 4.3% growth rate at the end of the OE period. January 2020 is the first month in which the new OE beneficiaries are reflected in the enrollment counts.
California, Florida, and Texas have the highest Medicare Advantage raw enrollment numbers. Starting with a more obvious take away, California leads with a total January 2020 MA enrollment of 2,834,366. However, this was only a growth of 1.56% during OE. Florida on the other hand has a total MA enrollment of 2,206,937 with a 3.23% growth rate. Lastly, Texas has a total of 1,756,884 MA enrollees with an OE growth rate of 4.08%. For our members, when taken assessed in tandem with some of our other data, this helps to shed light on if the market is MA saturated or can sustain additional plans.
Eight states or territories lead the nation with an OE growth rate of over ~10%. It is no surprise that these states range in scale of beneficiary enrollment. Of these eight regions, Michigan leads the way with the highest overall beneficiary enrollment of 969,643 in January of 2020. Additionally, it is important to note that Kansas crossed the 100,000 beneficiary enrollment threshold.
| State | January 2020 Enrollment | December 2019 Enrollment | Percent Open Enrollment Growth |
|---|---|---|---|
| Virgin Islands | 48 | 41 | 17.07% |
| Nebraska | 65,985 | 58,078 | 13.61% |
| Delaware | 37,630 | 34,059 | 10.48% |
| Kansas | 110,176 | 99,830 | 10.36% |
| New Hampshire | 62,136 | 56,357 | 10.25% |
| Vermont | 19,543 | 17,744 | 10.14% |
| Mississippi | 135,104 | 122,729 | 10.08% |
| Michigan | 969,643 | 881,906 | 9.95% |
In looking at a product level among health plans, Humana Insurance Company has the highest beneficiary MA enrollment in January of 2020. This totals 1,119,630 beneficiaries. (Please note: This is not aggregated across parent organization names. Overall, this plan grew at a rate of 4%. It was followed by Sierra Health and Life Insurance (part of UnitedHealthcare Company) with a total of 676,346 beneficiaries and a -3% growth rate.
Additionally, as a reference, the table below shows the top 20 parent plans overall by January 2020 enrollment numbers.
| Parent Organization | Number of Beneficiaries Enrolled in January of 2020 | % Growth from December 2019 |
|---|---|---|
| UnitedHealth Group, Inc. | 5,995,792 | 3.71% |
| Humana Inc. | 4,367,912 | 6.37% |
| CVS Health Corporation | 2,508,070 | 7.40% |
| Anthem Inc. | 1,283,485 | 7.54% |
| Kaiser Foundation Health Plan, Inc. | 910,254 | -0.51% |
| Blue Cross Blue Shield of Michigan Mutual Ins. Co. | 582,028 | 11.35% |
| WellCare Health Plans, Inc. | 580,004 | 3.85% |
| CIGNA | 485,067 | 9.63% |
| Centene Corporation | 290,882 | -5.66% |
| InnovaCare Inc. | 260,471 | -1.70% |
| Highmark Health | 233,668 | 5.45% |
| UPMC Health System | 189,261 | -2.15% |
| Healthfirst, Inc. | 184,443 | 6.96% |
| Medical Card System, Inc. | 175,460 | 4.21% |
| EmblemHealth, Inc. | 170,983 | -0.73% |
| Spectrum Health System | 168,404 | 7.80% |
| Guidewell Mutual Holding Corporation | 162,617 | 0.38% |
| BlueCross BlueShield of Tennessee | 156,201 | 4.51% |
| Lifetime Healthcare, Inc. | 154,701 | -0.15% |
| California Physicians’ Service | 147,030 | 0.85% |
Incorporate Medicare Advantage Enrollment Data to Your Strategy
While this data can inform your strategy in many aspects, CareJourney focuses on the insights in several ways.
First, Medicare Advantage is becoming a more prominent force in the health plan market. With that in mind, when any of our members are entering new markets, we regularly incorporate enrollment trends for a particular region into our analytics and advice. This helps us identify partners, peers, competition, and overall market interest.
Second, when considered in tandem with our other analytics, Medicare Advantage enrollment data helps our members identify overall plan performance and hone in on opportunities to apply fee-for-service provider level insights.
